A Simmer first! This LIVE edition was recorded on April 10 at the Boston University Hospitality Leadership Summit. We’re joined by Judy Thelan, co-founder and CEO of white-hot social restaurant list-keeping and recommendations app Beli. In this episode, we talk about professional criticism, Beli’s plans to work with restaurants, and its big bet that we really just want to hear from people we trust.
Blog
-

The Simmer Podcast—Noah Glass, CEO, Olo (Round 2)
We love repeat guests on The Simmer! In his return to the podcast, Olo founder and CEO Noah Glass explains the next phase of his company’s evolution: the Olo Network. In this episode, we talk about Olo’s move from a publicly traded company to a privately held asset last year, plus the power of an ordering network and why Olo coined a new term — “second-party ordering” to describe its big bet on the future.
-
The Spring Menu Playbook: How Regional Franchise Operators Engineer Seasonal Profitability
At a brand with 10, 20, or 50 locations, the spring menu season looks a little different than it does at the unit level. You’re not designing the menu—corporate is. What you’re doing is something harder: executing someone else’s vision profitably, consistently, across a portfolio of locations with different volume profiles, different staffing realities, and different guest mixes.
That’s the tension most regional franchise operators don’t talk about openly. The spring LTO comes down from brand. The contribution margin target is yours to hit. The upsell strategy—if there is one—is often under-defined. And the data that would tell you whether any of it is working tends to live in systems that don’t talk to each other cleanly.
The pressure on either side of that tension is real. 82% of operators reported higher average food costs in 2025, with the NRA’s data showing food costs running more than 35% above pre-pandemic levels. At the same time, 95% of operators say consumers are more value-conscious than they used to be—making price sensitivity a ceiling that’s increasingly difficult to push through, even with a seasonal LTO.
Spring feels exciting. For a regional operator managing margin across dozens of units, it also carries real risk if it isn’t approached analytically.
Here’s the argument: seasonal menu transitions are among the highest-leverage moments in a franchise operator’s calendar. Done well, they drive traffic, improve per-guest profitability, and generate location-level data that informs smarter decisions across the rest of the year. Done wrong, they create execution inconsistency across your portfolio—some units running the LTO well, others burying it—and burn operational bandwidth on items that never earn their place.
Most regional operators treat spring menu planning as an implementation exercise. The ones who outperform treat it as an engineering problem.
The Menu Engineering Framework, Applied at Scale
The menu engineering framework isn’t new—it was developed by Michael Kasavana and Donald Smith at Michigan State—but it’s underused at the regional franchise level, where operators often have access to more data than their single-unit counterparts but less freedom to act on it unilaterally.
Understanding the framework is still essential, because it shapes how you evaluate brand-mandated items against your actual portfolio performance—and how you make the case internally when something isn’t working.

The four quadrants:
Stars: high popularity, high contribution margin. Protect these. They’re the items your locations can’t afford to deprioritize in favor of a new seasonal push.
Plow Horses: high popularity, low profitability margin. These sell well and feel like wins. They often aren’t. At scale, Plow Horses that dominate the mix quietly suppress your average contribution margin per transaction across every unit.
Puzzles: low popularity, high profitability margin. These are the items that need your merchandising attention most—and in a kiosk or digital ordering environment, they’re the items most likely to be overlooked without active intervention.
Dogs: low popularity, low profitability margin. At the regional level, the ability to retire these may sit with brand—but the data case for doing so is yours to build.
The two metrics that drive the analysis:
- Profitability/Contribution margin: selling price minus food cost per item. According to NRA data, food and beverage costs for limited-service operators ran a median of 32.4% of sales in 2024—useful context, but food cost percentage can obscure what actually matters at volume. A $14 item with $4 in food cost contributes $10 to margin. A $9 item at 28% food cost contributes $6.48. Across 40 locations doing hundreds of transactions a day, that gap is not theoretical.
- Popularity index: an item’s share of total sales in its category, tracked per location. At the regional level, this matters not just in aggregate but as a consistency signal—wide variance in popularity index across locations often points to an execution or merchandising problem, not a product problem.
The spring relevance: every brand-mandated seasonal item should be run through this framework at the regional level before rollout—not to override brand decisions, but to inform how you price, position, and sell them across your portfolio.
The Spring Opportunity (And the Trap)
Spring is one of two annual windows—along with fall—when guests actively expect menus to change. That expectation is a genuine asset, and it operates at the brand level as much as the unit level. Guests who follow the brand are primed for something new. The regional operator’s job is to convert that priming into actual margin.
What the spring window makes possible at the regional level:
- Phasing out underperforming items without guest friction—seasonal transitions give cover for removal that mid-year changes don’t
- Introducing brand-designed LTOs with a local execution strategy that the brand hasn’t fully specified (more on that in Section 4)
- Using the novelty of seasonal items to test upsell prompts and price attachment behavior across your portfolio—data that becomes proprietary insight for your group
Spring ingredients—asparagus, strawberries, lemon, peas, fresh herbs, lighter proteins—carry strong perceived value with guests. When sourced in season, they tend to support favorable margins relative to their perceived quality. That’s the brand’s sourcing call, but the margin benefit is yours to protect or lose in execution.
The trap at the regional level looks different from what it does for independent operators.
It’s not usually a failure to design the right items. It’s a failure to execute them consistently across locations. Three patterns show up repeatedly in regional franchise portfolios:
Inconsistent rollout across units. Some locations merchandise the spring LTO aggressively; others treat it like a footnote. The result is wide performance variance that makes it nearly impossible to evaluate whether the item itself works. You can’t improve what you can’t measure cleanly.
Treating the brand’s LTO strategy as the complete strategy. Brand provides the item, the pricing, and the promotional materials. What brand often doesn’t provide is a location-level upsell plan, a merchandising sequence for kiosk and digital ordering, or a defined evaluation framework. Filling those gaps is the regional operator’s leverage point.
Pricing drift at the unit level. In multi-unit portfolios, it’s common for individual locations to apply discounts, modify modifiers, or run local promotions that quietly erode the contribution margin of a brand-designed LTO. At 10 units, this is manageable. At 50 units, it becomes a significant margin leak if it isn’t actively monitored.
Start with Your Portfolio Data, Not the Brand Playbook
The instinct at the regional level is often to wait for brand guidance before doing any planning. That’s an understandable instinct—and it leaves significant value on the table.
The data audit that should happen before any spring rollout begins is entirely within your control, and it shapes how you execute regardless of what brand provides.
The right questions to ask across your portfolio before spring planning begins:
- Which locations have the highest average contribution margin per transaction, and what’s driving the difference? Understanding your top performers’ item mix tells you something about what to replicate in merchandising and upsell strategy.
- Where do your current Stars and Plow Horses sit across locations? An item that performs as a Star at your top-volume units may be a Plowhorse at lower-volume locations. And that distinction changes how you merchandise it.
- Which items consistently appear in multi-item orders? Attachment behavior varies by location and daypart, and that variation is information. A spring LTO that pairs naturally with a high-attachment item is a better upsell target than one that stands alone.
- Are there daypart gaps that a spring item could address? A lighter spring offering that drives lunch traffic is more valuable to your portfolio than one that spikes on weekend dinner and fades by mid-week.
The kiosk advantage for regional operators:
At 10–50 units, kiosk and digital ordering data are among the most valuable assets you have—and it’s often underused. Unlike verbal ordering data, kiosk data is structured, consistent, and captures behavior that aggregated POS data misses: what was browsed versus purchased, which add-ons were accepted at which locations, and how item placement on the screen affected sales mix across your portfolio.
This is the data foundation for informed spring planning. It’s also the input layer that Bite Lift uses to surface the right upsell at the right moment—not as a static prompt, but as a dynamic recommendation tuned to the guest, the item, and your margin priorities.
Building Your Execution Strategy Around Brand LTOs
The LTO environment across the industry right now is more competitive than it’s ever been. According to Technomic Ignite Menu data, LTO launches rose 19% year over year as of late 2025, with the full year tracking 10% above 2024. Technomic tracked 17,790 restaurant LTO launches in 2020; by 2024, that figure had grown to 36,830—more than double in five years. And 55% of consumers now say a restaurant’s LTO offerings factor into where they choose to eat, up from 50% in 2022.
For a regional franchisee, those numbers mean two things simultaneously: brand’s instinct to run seasonal LTOs is strategically correct, and the execution gap between operators who merchandise them well and operators who don’t is growing more consequential.
Where regional operators build their edge:
Operational preparation before launch, not after. Brand announces the spring LTO. The question to answer before it hits your locations: Does this item extend prep workflow in ways that create throughput risk at peak hours? If so, which locations are most exposed, and what’s the mitigation plan? The operators who ask these questions before launch are the ones who don’t spend six weeks watching a good item underperform because of a fixable execution problem.
A location-level merchandising plan. Research from Kerry found that 88% of consumers rated point-of-sale promotions as one of the three most influential purchase drivers for LTOs—making in-the-moment presentation a primary driver of LTO performance, not a secondary one. Brand may provide creative assets—the question is whether those assets are being deployed at every location, in every relevant touchpoint, with the same consistency. In a 50-unit portfolio, the answer is seldom yes without active oversight.
Pre-defined evaluation criteria. Before a spring LTO launches across your portfolio, define the benchmarks: What sales volume justifies the operational complexity? At what contribution margin does the item earn a permanent recommendation to brand? What upsell attachment rate indicates the item has real cross-sell potential? Setting these benchmarks before launch transforms the LTO from a brand mandate you’re executing into a business experiment you’re running—with findings that have value beyond the season.
Monitoring for margin drift. Across 10–50 locations, discount application, modifier behavior, and local promotional decisions can quietly erode the profitability/contribution margin of a brand-designed item. Building a monitoring cadence into your spring rollout—not just for sales volume but for actual contribution margin by location—is the difference between knowing your LTO is working and assuming it is.
How AI Upselling Changes the Seasonal Execution Equation
The structural challenge for regional operators running a spring menu isn’t getting guests to the restaurant. It’s getting guests who are already there—already at the kiosk, already in the app—to engage with a new item they didn’t come in planning to order.
Human upselling is inconsistent at scale. A motivated team member at your best location might mention the spring special on 70% of interactions. Across 50 locations with varying staff tenure, training compliance, and peak-hour pressure, that number drops significantly and unpredictably. Traditional kiosk upsell prompts are an improvement—they’re consistent, but they’re static. They present the same prompt to every guest at the same moment, regardless of order history, item affinity, or which items in your portfolio need merchandising support most.
AI-driven upsell via kiosks changes the equation for regional operators in three concrete ways:
Targeting by guest behavior, not just by prompt position. A guest whose order history shows affinity for lighter proteins is a different upsell target for a spring salad than a guest whose history is built around burgers and loaded fries. Bite Lift surfaces seasonal items to guests who are most likely to convert, rather than presenting the same prompt to every guest and measuring the average.
Weighted toward your margin priorities. The items that need active merchandising support are almost always Puzzles—high contribution margin, lower organic popularity. A well-configured AI upsell system via kiosk can be weighted to push those items harder across your portfolio, turning underperforming high-margin SKUs into active contributors. This is the kind of portfolio-level margin management that’s difficult to achieve through staff training alone.
Consistent across every location, every shift. For a regional operator, consistency of execution is the variable that determines whether portfolio-level analysis means anything. If your top five locations are executing the spring upsell strategy well and your bottom ten aren’t, your aggregate data is noise. Bite Lift delivers the same quality of upsell execution at every kiosk, across every unit, on every shift—which means the data you get back is actually actionable.
The Post-Season Data Harvest
This is the step most regional operators skip—and where the compounding value of disciplined execution either gets captured or evaporates.
The spring menu is not just a revenue event for your portfolio. It’s a research event. Every LTO and seasonal item generates location-level data about guest preference, price sensitivity, attachment behavior, and operational throughput that has direct implications for fall planning—and for the case you make to brand about what worked, what didn’t, and what should change.
Before retiring spring items, capture across your portfolio:
- Final contribution margin versus projected, by location. Did margin drift occur? Where, and why? This is the data that identifies which locations need operational or training attention before the next seasonal rollout.
- Upsell attachment rate by location and daypart. Wide variance here is an execution signal. Locations with strong attachment rates are doing something replicable. Locations with weak attachment rates need a different intervention.
- Multi-item order frequency for seasonal items. Which spring items appeared most often alongside other items? Strong pair performance is a signal for future bundling strategy and kiosk menu architecture.
- Any items that generated repeat guest requests after retirement. This is among the strongest signals you can bring to brand when making the case for a permanent addition or a returning LTO next spring.
Regional operators who build this feedback loop systematically such as using spring data to inform fall design, fall data to inform the following spring, create a compounding advantage over operators who treat each season as a fresh start. Over a two- to three-year horizon, the margin gap between those two operating approaches becomes significant.
Menu Engineering Is a System, Not a Season
For a regional franchise operator running 10 to 50 locations, the spring menu season is never just about the items. It’s about execution consistency, contribution margin management across a portfolio, and turning brand-level decisions into location-level performance.
The operators who outperform in Q2 are the ones who start with a data audit instead of a brand briefing, define their evaluation criteria before launch instead of after, and close the execution gap at the kiosk with tools that don’t depend on staff consistency to deliver results.
The tools to do this at the regional scale already exist. The question is whether you’re using them.
- Profitability/Contribution margin: selling price minus food cost per item. According to NRA data, food and beverage costs for limited-service operators ran a median of 32.4% of sales in 2024—useful context, but food cost percentage can obscure what actually matters at volume. A $14 item with $4 in food cost contributes $10 to margin. A $9 item at 28% food cost contributes $6.48. Across 40 locations doing hundreds of transactions a day, that gap is not theoretical.
-
The Simmer Podcast—Sam Bakhshandehpour, President, Local Merchants, Bilt
Former Jose Andres Group CEO Sam Bakhshandehpour recently joined Bilt, a $10 billion loyalty platform that rewards people for paying their rent and mortgage on Bilt cards, helping to fuel the so-called “points economy.” Recently, the company released a flashy video full of top-name chefs and restaurateurs to launch Bilt Hospitality, a kind of digital concierge service targeted at restaurants. But what is it, exactly? And how does it work? In this episode, Sam answers these questions and more — including when we might see a launch video with more than one woman in it.
-
Comparing Labor Models: Traditional vs. Tech-Enabled Operations
A side-by-side analysis of staffing approaches, costs, and guest experience—and when each model makes sense for your restaurant
Picture two nearly identical fast-casual restaurants. Same revenue, same menu complexity, same market. Yet one operates with eight staff members during peak hours, while the other runs smoothly with six. One struggles with 30% labor costs while the other maintains 25%. The difference? Their labor model.
As restaurant operators navigate persistent staffing challenges and labor costs that now exceed 26% of revenue, the question isn’t just “how do we find workers?” It’s “how do we structure our operations to do more with the team we have?”
The answer increasingly lies in choosing—or blending—the right labor model for your concept. Here’s an honest comparison of traditional and tech-enabled approaches, complete with real costs, guest experience considerations, and when each makes sense.
The Two Models: What They Actually Look Like
Traditional Labor Model
The traditional model is human-powered at every touchpoint. Cashiers take orders, suggest add-ons, and process payments. Staff manually coordinate between front and back of house. Paper tickets or basic POS systems manage the flow.
Typical peak-hour staffing for a location doing $25,000/week:
- Front of house: 2-3 cashiers, 1 expediter, 1 host/greeter
- Back of house: 3-4 line cooks, 1-2 prep staff, 1 dishwasher
- Total: 8-10 staff members
Where it excels: Fine dining, boutique cafes, and concepts where personalized service is the brand differentiator. When guests are paying for an experience, not just a meal, human interaction adds value that technology can’t replicate.
Tech-Enabled Labor Model
The tech-enabled model deploys self-service ordering (kiosks, mobile apps, QR codes), kitchen display systems, and often AI-powered scheduling. Staff shift from transactional roles to hospitality and problem-solving.
Typical peak-hour staffing for the same $25,000/week location:
- Front of house: 1 cashier/kiosk ambassador, 1 runner, 1 hospitality lead
- Back of house: 3-4 line cooks, 1-2 prep staff, 1 dishwasher (similar to traditional)
- Total: 6-8 staff members
Where it excels: High-volume QSR and fast casual, locations with severe labor shortages, markets with $18+/hour wages, and concepts where speed and convenience are competitive advantages.
The Real Cost Comparison
Labor Expenses
Let’s run the numbers for a fast-casual location generating $25,000 in weekly revenue:
Traditional Model:
- Front-of-house: 3 cashiers × 40 hours × $18/hour = $2,160/week
- Additional FOH support: ~$800/week
- Weekly FOH labor: ~$2,960
- As % of revenue: 11.8%
- With back-of-house included: Total labor ~19-21% of revenue
Tech-Enabled Model:
- Front-of-house: 1 cashier × 40 hours × $18/hour = $720/week
- Additional FOH support: ~$800/week
- Technology costs: $150-200/week (kiosk amortization, software)
- Weekly FOH labor + tech: ~$1,700
- As % of revenue: 6.8%
- With back-of-house included: Total labor ~17-18% of revenue
The savings: Roughly $600-700/week, or $31,200-36,400 annually in labor costs alone.
For context, QSR operators typically target 25% labor costs, with two-thirds of restaurants maintaining labor between 20-30% of revenue. Every percentage point matters when margins are razor-thin.
Hidden Costs That Change the Math
Traditional model:
- Turnover impact: At 73.9% annual turnover, replacing 6 FOH staff annually costs $9,000-$15,000
- Training time: 2-3 weeks to proficiency for each cashier
- Order errors: Industry averages show human order-taking produces error rates that technology dramatically reduces
Tech-enabled model:
- Initial investment: $2,000-$8,000 per kiosk, plus installation
- Maintenance: Ongoing software fees, hardware refresh every 3-5 years
- Adoption curve: 4-8 weeks to reach optimal kiosk usage rates
- Staff adaptation: Training on new “kiosk ambassador” roles
The ROI typically materializes in 6-12 months—faster for multi-unit rollouts with volume discounts.
Guest Experience: What the Data Shows
Consumer preferences are shifting rapidly. Seventy-two percent of consumers are now comfortable using in-store kiosks, up from 59% the previous year, according to a March 2025 survey by the Kiosk Industry Association. This comfort translates to behavioral change: 62% of kiosk users report discovering new menu items or customizations they weren’t previously aware of, and 76% say kiosks led them to buy more than they intended at least once.
Traditional Model Strengths:
- Personal connection and relationship-building with regulars
- Real-time menu guidance and answering questions
- Accommodating complex dietary needs or special requests
- Reading guest cues and adjusting service accordingly
Tech-Enabled Model Strengths:
- Self-service kiosks contribute to 99% order accuracy, compared to 91-95% with cashiers
- 76% of kiosk users buy more than intended at least occasionally
- Multiple guests ordering simultaneously during rushes
- No pressure to order quickly; browse at your own pace
- Reduce total order time by nearly 40%
The trade-off? A 2025 mystery shopping study found that while kiosks excel at speed and accuracy, friendliness scores dropped to 66%—lower than any other ordering method. Technology solves for efficiency; it doesn’t automatically solve for hospitality.
Revenue Impact: The Upselling Advantage
Perhaps the most compelling argument for tech-enabled models is revenue per transaction.
McDonald’s reported that customers using kiosks spent nearly $1 more per order, resulting in a 30% rise in average check size. This isn’t an outlier. Industry-wide, 67% of restaurants with kiosks report increased check sizes.
The mechanism is simple: kiosks never forget to suggest add-ons. They don’t get tired, distracted, or uncomfortable upselling. They present recommendations at the optimal moment with visual appeal.
Real-world example: Urbane Cafe saw a 22% higher check average on kiosk orders and 5.6% total sales lift across 16 locations. Their approach? Maintain one cashier who serves as a kiosk ambassador, guiding guests when needed while letting technology handle the transaction.
“We used to have two cashiers. Now we really only have one,” says Caprice Kindgren, Director of Marketing at Urbane Cafe. “It’s not like we’re giving worse guest service because there’s a kiosk—you just make sure you’re still welcoming guests.”
The Hybrid Approach: Best of Both Worlds
The most successful operators aren’t choosing between models—they’re blending them.
The hybrid model features kiosks prominently placed at the entrance, one cashier for guests who prefer human interaction, and staff trained to assist kiosk users when needed. Technology handles transactions; humans handle hospitality, problem-solving, and relationship-building.
This approach addresses the friendliness gap while capturing the efficiency gains. Staff feel more valued doing meaningful work instead of repetitive order-taking. Turnover often decreases when employees transition from transactional to hospitality-focused roles.
Decision Framework: Which Model Is Right for You?
Strong candidates for tech-enabled models:
- QSR and fast-casual concepts
- Weekly revenue above $20,000
- Labor costs exceeding 30% of revenue
- Markets with $18+/hour wages
- Younger demographic (18-45 core customers)
- Speed and convenience as competitive advantages
Strong candidates for traditional models:
- Fine dining and full-service restaurants
- Concepts where service is the product, not just the delivery mechanism
- Older demographic (55+)
- Complex menus requiring extensive guest education
- Brand built on personal relationships
Hybrid model works best for:
- Fast casual bridging QSR and full-service
- Diverse demographics requiring flexibility
- Franchise systems with varied locations
- Operators testing technology adoption
Questions to ask yourself:
- What’s my current labor cost as a percentage of revenue?
- What’s my annual staff turnover rate?
- Who is my core customer demographic?
- Do I compete on speed and convenience or on experience?
- Can I accommodate 1-3 kiosks without compromising guest flow?
The Bottom Line
There’s no universal answer to the labor model question. A Michelin-starred restaurant spending 35-40% on labor isn’t inefficient—they’re investing in the experience that justifies their pricing. Conversely, a QSR hitting 25% labor costs through technology isn’t cutting corners—they’re optimizing for their service model.
The real question isn’t “Should we use technology?” It’s “How much technology serves our guests best while optimizing our operations?”
As 49% of restaurants express optimism about technology’s role in reducing labor costs, the operators who will thrive are those who find the right balance for their concept, their market, and most importantly, their guests.
The best labor model is the one that delivers the experience YOUR guests expect in YOUR market—whether that’s powered by people, technology, or the strategic combination of both.
-

The 2026 State of Restaurant Labor: What’s Changed (and What Hasn’t)
How the restaurant industry’s workforce evolved from pandemic chaos to a new normal — and what operators need to know to compete for talent in today’s market
Key Data Points
Employment & Recovery
- 42,000 jobs (0.3%) above February 2020 levels as of February 2026 — National Restaurant Association
- QSR and fast-casual restaurants added 79,000 jobs (2%) above pre-pandemic levels — Escoffier
- 18 states plus D.C. remain below pre-pandemic restaurant employment — National Restaurant Association
- Industry added net 128,800 jobs during 12 months ending February 2026 — National Restaurant Association
Wages & Compensation
- Average hourly wages jumped from $13.36 (April 2020) to $19.93 (December 2025) — Restaurant Dive
- Leisure and hospitality sector wages increased 3.8% year-over-year to $22.70 (April 2025) — OysterLink
- Waiters and servers earn average base wage of $17.56 per hour before tips — OysterLink
- Base wages now make up 43% of restaurant worker pay, up from 35% in January 2020 — ADP Research Institute
- Median hourly wage for waiters/waitresses ($15.36) vs. all-profession median ($23.11) — Kezner Consulting
Labor Shortage & Staffing
- 70% of operators report job openings difficult to fill; 45% don’t have enough employees — NetSuite/National Restaurant Association
- 986,000 job openings in restaurants and accommodations sector (October 2025) — National Restaurant Association
- Restaurant unemployment ranged between 5.5% and 6.8% in recent months — Restaurant Dive
- Turnover rates at 73.9% annually — Toast
Technology Impact
- Urbane Cafe: 22% higher check average on kiosk orders and 5.6% lift in total sales — Bite Case Study
2026 Projections
- Industry projected to add more than 100,000 jobs in 2026, reaching 15.8 million employees — National Restaurant Association
The restaurant labor market has undergone seismic shifts over the past five years. From the devastating pandemic job losses that saw over 3.7 million restaurant workers unemployed in early 2020, to the scramble for talent during the recovery, to where we stand today, restaurant operators have weathered a transformation that fundamentally changed how the industry approaches staffing.
As we navigate 2026, one thing is clear: we’ve reached a “new normal” that looks distinctly different from the pre-pandemic world. The question for operators is no longer “how do we get back to normal?” but rather “how do we thrive in this transformed landscape?”
Let’s examine what’s actually changed, what’s remained stubbornly the same, and what strategies are working for operators who are winning the war for talent.
The Numbers Tell a Complex Story
Employment Has Recovered… Sort Of
The headline news sounds positive: as of February 2026, restaurant employment stands at 42,000 jobs above February 2020 levels, representing a 0.3% gain. While this marks a recovery from the pandemic’s devastating job losses, the modest gains and month-to-month volatility—January saw the industry at 105,000 jobs above pre-pandemic levels before winter weather impacted February—reveal an industry still finding its footing.
But dig deeper, and the picture becomes more nuanced.
Full-service restaurants—the traditional sit-down establishments that were hardest hit during the pandemic—are still struggling to return to pre-pandemic staffing levels. While quick-service and fast-casual restaurants have added 79,000 jobs (2%) above pre-pandemic levels, full-service dining continues to lag behind.
The geographic distribution tells another story entirely. Eighteen states plus Washington D.C. remain below pre-pandemic restaurant employment, led by West Virginia (-6%), Maine (-5%), and New Mexico (-5%). Meanwhile, mountain states like Idaho (+20%), Utah (+14%), and Nevada (+13%) have surged well past their 2020 employment levels.
What This Means for Operators: The recovery isn’t uniform. Your experience depends heavily on your restaurant concept (QSR vs. full-service) and your location. If you’re in a lagging market, you’re competing for an even smaller pool of available workers.
Wages: The Gains Are Real, But Slowing
Perhaps the most significant change in the restaurant labor market is compensation. The numbers are striking:
- Average hourly wages for production and nonsupervisory restaurant workers jumped from $13.36 in April 2020 to $19.68—a nearly 50% nominal increase
- Average hourly earnings in the leisure and hospitality sector increased 3.8% year-over-year, from $21.87 in April 2024 to $22.70 in April 2025
- Waiters and servers now earn an average base wage of $17.56 per hour before tips, with tips making up approximately 69% of their hourly earnings.
The wage surge of 2021-2022, when restaurants saw year-over-year wage growth of 10-15%, has cooled considerably. Wage growth has moderated to more sustainable levels, but the gains made during those years have stuck.
Interestingly, base wages now make up 43% of restaurant worker pay, up from 35% in January 2020, as minimum wage increases and changing tipping behaviors reshape compensation structures.
What’s Changed: Restaurants can no longer compete for talent with pre-pandemic wages. The $15/hour floor that was once debated is now baseline in most markets, with many operators paying $18-20/hour or more.
What Hasn’t Changed: The fundamental wage gap between restaurants and other industries persists. The median hourly wage for waiters and waitresses ($15.36), including tips, is significantly lower than the all-profession median of $23.11, making it difficult to attract talent away from other sectors.
The Labor Shortage: Still Here, But Evolving
Job Openings vs. Available Workers
Despite employment gains, the labor shortage hasn’t disappeared—it’s just evolved. Seventy percent of restaurant operators report having job openings that are difficult to fill, while 45% say they don’t have enough employees to support existing customer demand, according to the National Restaurant Association.
The challenge is structural: there are consistently more job openings than available workers to fill them. While the gap has narrowed from pandemic highs, demand for workers remains elevated. As of October 2025, there were 986,000 job openings in the combined restaurants and accommodations sector, roughly unchanged from earlier months despite ongoing hiring challenges. The industry added a net 128,800 jobs during the 12 months ending February 2026, yet demand for workers continues to outpace supply.
The Turnover Challenge Remains
If there’s one metric that hasn’t fundamentally improved, it’s turnover. The restaurant industry continues to experience some of the highest turnover rates across all sectors.
While turnover rates have decreased from the peak of 2020 to around 73.9% annually, this remains extraordinarily high. To put it bluntly: roughly three out of every four employees will leave within a year.
The financial impact is devastating. Every departing employee costs money in recruitment, training, and lost productivity. With tight margins already squeezed by food costs and rent, high turnover is one expense operators can’t afford but can’t seem to escape.
What’s Changed: The “Great Resignation” has shifted to what experts call the “Great Stay”—workers are staying in their jobs longer, but not necessarily in the restaurant industry.
What Hasn’t Changed: Restaurant work is still fast-paced, physically demanding, and often involves irregular hours. These fundamental aspects of the job contribute to burnout and drive turnover, regardless of economic conditions.
Why Workers Still Aren’t Returning
The pandemic fundamentally reset worker expectations. Many who left restaurant jobs during COVID discovered:
1. Better Work-Life Balance Exists Elsewhere
Other industries like retail and delivery services offer more predictable hours and often better benefits. A gig economy driver can set their own schedule; a retail worker knows they’ll be off by 9 PM. Restaurant work, with its split shifts, weekend requirements, and unpredictable schedules, struggles to compete.
2. Rising Costs of Living Require Higher, More Stable Pay
While wages have increased, inflation has eaten into those gains. Real wages—adjusted for inflation—have increased only modestly since 2018. Workers need not just higher pay, but also predictable pay. The tip-dependent model, while potentially lucrative for some, introduces income volatility that many workers can no longer afford.
3. Health and Safety Concerns Linger
Though COVID restrictions have eased, health and safety concerns continue to influence job choices. Workers in customer-facing roles remain exposed to illness, and some simply aren’t willing to take that risk for restaurant wages.
4. The Job Itself Hasn’t Changed
Perhaps most fundamentally, restaurant work is still restaurant work. It’s physically demanding, often stressful, and involves dealing with difficult customers. No amount of wage increases changes the fundamental nature of the job—and for workers who found alternatives during the pandemic, there’s simply no compelling reason to return.
What’s Actually Working: Strategies from Successful Operators
While the challenges are real, some operators are finding success. Here’s what’s working:
1. Technology as a Labor Multiplier
Smart operators aren’t just trying to fill positions—they’re reducing the number of positions they need to fill in the first place.
Kiosk ordering systems reduce the need for order-takers, allowing restaurants to maintain throughput with fewer front-of-house staff. This isn’t about eliminating jobs; it’s about reallocating labor to higher-value activities.
Urbane Cafe, a 43-location fast casual chain, reallocated labor at the front of house after implementing kiosks. Locations that previously relied on two cashiers now operate efficiently with one team member serving as a cashier, kiosk ambassador, and guest experience facilitator.
“We used to have two cashiers. Now we really only have one,” says Caprice Kindgren, Director of Marketing at Urbane Cafe. “It’s not like we’re giving worse guest service because there’s a kiosk—you just make sure you’re still welcoming guests.”
The result? A 22% higher check average on kiosk orders and a 5.6% lift in total sales across 16 locations.
Mobile ordering, QR code menus, and contactless payment all serve the same purpose: doing more with the staff you have.
2. Flexible Scheduling and Quality of Life
The operators winning the talent war are those who recognize that competitive wages are table stakes—the real differentiator is quality of life.
Flexible scheduling options that accommodate workers’ needs—whether that’s childcare, school, or other commitments—make restaurant jobs more attractive. Some operators are experimenting with guaranteed minimum hours to provide income stability, while others offer shift-swapping apps that give workers more control.
3. Career Development and Growth Opportunities
Workers, especially younger ones, want to know there’s a path forward. Operators who invest in training programs, create clear advancement paths, and support professional development are seeing better retention.
The key is making these opportunities visible and accessible from day one. Don’t wait six months to tell a new hire they could be a manager—show them the path during orientation.
4. Benefits That Actually Matter
Health insurance, paid time off, and retirement plans were once rare in restaurants. They’re becoming standard among operators who want to compete for talent.
But benefits need to match worker needs. For part-time workers, access to earned wage access (getting paid for shifts already worked before payday) can be more valuable than a 401(k). For parents, childcare assistance or flexible scheduling trumps many traditional benefits.
5. Streamlining the Hiring Process
In a competitive labor market, speed matters. Technology-enabled hiring that streamlines applications and onboarding can be the difference between securing a good candidate and losing them to a competitor who moves faster.
Operators are using SMS-based recruitment, virtual interviews, and streamlined onboarding to reduce time-to-hire from weeks to days.
The Road Ahead: What to Expect in 2026
As we move through 2026, several trends are likely to shape the restaurant labor market:
The Industry Will Stabilize, Not Return
Don’t expect a return to pre-pandemic labor dynamics. The industry is projected to add more than 100,000 jobs in 2026, reaching 15.8 million employees, but the fundamental challenges around wages, turnover, and competition for workers will persist.
Regional Divergence Will Continue
Labor markets will remain highly local. Some states are seeing robust growth while others lag, and this pattern will likely continue. Operators need to understand their local market conditions rather than relying on national trends.
Technology Adoption Will Accelerate
Labor shortages are accelerating technology adoption across the industry. From AI-powered scheduling to robotic kitchen assistants to kiosk ordering, operators are increasingly turning to technology not as a nice-to-have but as a necessity.
The question isn’t whether to adopt labor-saving technology, but which technologies and when.
The War for Talent Will Remain Intense
With low unemployment rates and workers having more options than ever, restaurants will continue competing not just with each other but with every other employer in their market.
The operators who succeed will be those who recognize this reality and adapt accordingly—through better compensation, better work environments, better scheduling, and better use of technology to make their employees more productive.
The Bottom Line
The state of restaurant labor in 2026 is a study in contrasts. Employment has recovered, but not evenly. Wages have increased significantly, yet staffing challenges persist. Workers have more options, but restaurants still need to fill positions.
What’s become abundantly clear is that there’s no going back to 2019. The pandemic permanently reset the labor market, and successful operators are those who’ve accepted this new reality and adapted their strategies accordingly.
The path forward requires a multi-faceted approach:
- Competitive wages and meaningful benefits to attract talent
- Technology to multiply the productivity of the staff you have
- Flexible scheduling and quality-of-life improvements to retain workers
- Efficient hiring processes to move quickly when good candidates appear
- Career development opportunities to build long-term loyalty
The restaurant labor shortage of 2020-2022 may have evolved into something more manageable, but make no mistake: the fundamental challenge of attracting and retaining talent in a competitive market isn’t going away. The operators who will thrive in 2026 and beyond are those who treat labor strategy not as a cost to minimize, but as a competitive advantage to maximize.
-
The Simmer Podcast—Ben Leventhal, Founder & CEO, Blackbird
Check out the latest episode of The Simmer, where Brandon and Kristen sat down with Ben Leventhal, the mind behind Eater and Resy. Now he’s onto his next chapter: Blackbird, a loyalty and payments platform built specifically for the restaurant industry.
They get into:
- How restaurant loyalty is evolving (and why most programs still get it wrong)
- The so-called “reservations wars” and what they mean for operators
- Some genuinely great restaurant recommendations
Ben has shaped how we discover, book, and experience restaurants more than almost anyone. This conversation does not disappoint.
-
Urbane Cafe: How Guest-First Kiosk Technology Drove a 22% Lift in Check Average Across 16 Locations
Urbane Cafe is a fast casual restaurant brand known for its fresh, chef-driven menu and commitment to delivering a premium guest experience. With locations across Southern California, Urbane Cafe has built a reputation not just for its food, but for being a technology-forward brand in the fast casual space—consistently embracing innovation before it becomes the industry standard.
From launching one of the first native loyalty apps in fast casual to piloting AI-powered catering assistants, Urbane Cafe has always believed that meeting guests where they are means staying ahead of how they want to order, engage, and connect.
Kiosk is no exception.
“We’re not necessarily the very first person to jump on to new technologies, but we definitely are an early adopter in a lot of senses—we want to make sure that we are cutting edge when it comes to being in that space.” — Caprice Kindgren, Director of Marketing, Urbane Cafe
Business Name: Urbane Cafe
Interviewee: Caprice Kindgren, Director of Marketing
No. of Locations with Bite Kiosks: 16 (43 Total Locations)*
Case Study Data Period: October 14, 2025 – January 14, 2026
*Equals the number of live kiosk locations at the time of the case study date range
The Challenge: Rising Labor Costs and Changing Guest Preferences

As Urbane Cafe continued to grow and open new locations, three key challenges shaped their thinking around in-store technology.
Rising Labor Costs
Like most restaurant brands in recent years, Urbane Cafe felt the pressure of increasing labor costs at the front of house. Finding a smarter, more efficient way to handle ordering—without sacrificing the guest experience—became a real operational priority.
Meeting a New Generation of Guests
Urbane Cafe operates several locations near high schools and college campuses, where a significant portion of their guests are younger diners who seem to prefer not to interact with a cashier. For this demographic, a self-service kiosk isn’t just convenient—it’s the preferred way to order. The brand recognized early on that offering that option was essential to serving their full guest base.
“In some of our locations, like Chula Vista and Azusa, we really see high [kiosk] adoption because they are right next to a high school or college. That’s a huge demographic of people who just want to order and go sit down, or maybe feel a little nervous talking to a cashier.”
Building Technology Into the Brand Standard
As Urbane Cafe’s new restaurant pipeline grew, leadership wanted kiosks to be more than a test—they wanted it baked into the DNA of every new build. That meant finding a kiosk partner whose solution could be designed into new locations from the ground up, and who could grow alongside the brand.
The Solution: Restaurant Kiosk Deployment with Loyalty Integration

Urbane Cafe partnered with Bite to deploy kiosks as a core part of their new restaurant experience, layering in smart operational practices and a key loyalty integration to maximize impact.
Bite Kiosk Deployment—Built Into Every New Restaurant
What started as a pilot in one of Urbane Cafe’s locations has evolved into a brand standard. Today, every new Urbane Cafe build includes Bite kiosks as part of the restaurant’s core design, alongside digital menu boards and more. Placement was identified early on as critical to adoption: kiosks are positioned at the entrance so guests encounter them naturally as soon as they walk in the door.
Staff Training & The Kiosk Ambassador Program
One of Urbane Cafe’s most effective strategies has been investing in staff training. Rather than simply installing kiosks and expecting guests to figure it out, Urbane Cafe trained its cashiers to serve as kiosk ambassadors. If a guest is browsing the kiosk or appears uncertain, team members are empowered to walk over, guide them through the menu, and show them just how easy the ordering process is. This human touch has been instrumental in driving adoption and ensuring the kiosk enhances the guest relationship.
“Sometimes people think, ‘okay, we got kiosks, we can just cut the front of house.’ That’s not really what’s going to happen. You have to make sure you’re still welcoming guests. It’s an extension of meeting them where they are.”
Thanx Loyalty Integration—Removing the Friction
A pivotal moment in Urbane Cafe’s kiosk journey came when they integrated their Thanx loyalty program directly into the kiosk experience. Previously, guests who wanted to earn or redeem rewards had to scan a receipt or go through a separate process after ordering at the kiosk—a friction point that was a real barrier to adoption.
With the Bite and Thanx integration, guests can now simply enter their phone number or email at the kiosk, where their account, rewards, and points populate instantly. The result has been a meaningfully better experience for loyalty members and a stronger reason to choose kiosks over the traditional cashier line.
“People were saying, ‘I want to use the kiosk, but I can’t use my reward points.’ There was a hurdle there. Adding that capability really helped with the guest experience. Now you just put in your number or email, and it pops right up.”
The Results: 22% Higher Check Average and 5.6% Total Sales Lift

Across 16 locations over a three-month period, the impact of Bite kiosks at Urbane Cafe is clear—both in how guests are choosing to order and how much they’re spending when they do.
A 22% Higher Check Average
Guests ordering at the kiosk spend more. The average kiosk check came in at $23.14, compared to $19.01 at the cashier—a difference of $4.13 per order, resulting in a 22% higher check average. This lift is consistent with what Urbane Cafe sees anecdotally: guests at the kiosk feel less pressure to order quickly, take more time to browse the menu, and are more likely to add an extra item—whether that’s a cookie, a side, or an upgrade.
5.6% Lift In Total Sales
Over three months, Bite kiosks generated a 5.6% lift from total cashier and kiosk sales, thanks to a higher check size of $4.13 from kiosk-only sales.
26% Kiosk Adoption—With Significant Runway Ahead
Kiosks accounted for nearly 26% of all orders during the data period. And the growth story doesn’t stop there. Projections show that increasing adoption to just 35% would drive an estimated a 7.8% total sales lift—a clear signal that continued investment in kiosk placement, staff training, and guest education will pay off.
Labor Reallocation at the Front of House
Locations that previously relied on two cashiers now operate efficiently with one team member serving as a cashier, kiosk ambassador, and guest experience facilitator.
“We used to have two cashiers. Now we really only have one. It’s not like we’re giving worse guest service because there’s a kiosk—you just make sure you’re still welcoming guests.”
-
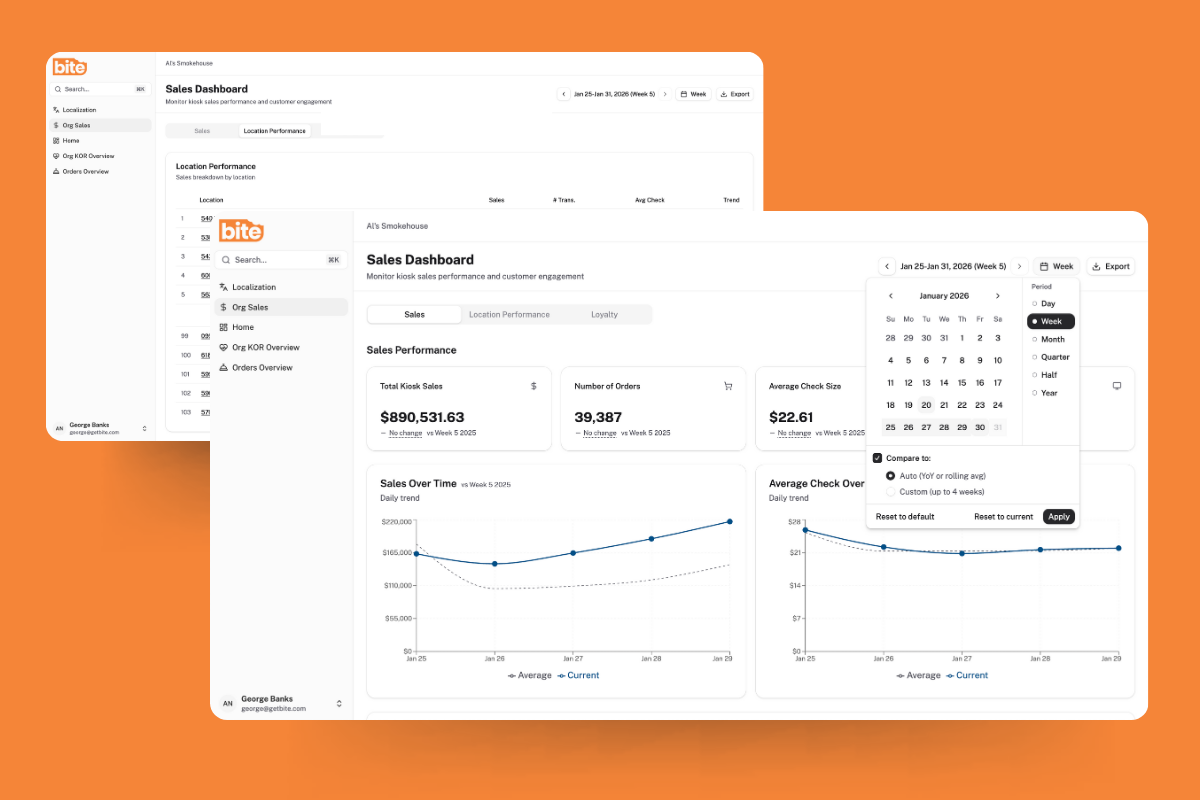
Track What Matters: How Bite’s Sales and Analytics Dashboard Turns Kiosk Data into Restaurant Growth
For restaurant operators, data is everywhere—but actionable insights? Those are harder to come by. You know your kiosks are processing orders, but do you know which locations are outperforming others? Which hours see the highest volume? How much revenue are you leaving on the table with low loyalty engagement?
That’s the challenge Bite set out to solve with our newest feature: the Sales & Analytics Dashboard, now available to all Bite Admin users.
Beyond Order Counts: What the Dashboard Actually Shows You
The Sales & Analytics Dashboard consolidates your kiosk performance data into a single, intuitive view. Instead of piecing together reports from multiple sources or relying on gut instinct, operators can now access real-time insights across their entire organization.
Here’s what you can track:

Sales Performance Across Your Footprint
View total sales, average check sizes, and order volume across all kiosk-enabled locations. Filter by specific date ranges to analyze performance during promotions, seasonal peaks, or new menu rollouts. Compare current performance against any historical period to spot trends and measure growth.

Location-Level Insights
Not all locations perform equally—and that’s valuable information. The dashboard makes it easy to identify your top performers and understand what’s working, while flagging underperforming locations that may need operational attention, menu adjustments, or additional staff training.

Hour-by-Hour Order Trends
Labor costs are one of the biggest line items for any restaurant. The dashboard breaks down order volume by hour, giving you the data you need to optimize staffing levels. See exactly when your kiosks are busiest, and schedule accordingly to improve service speed without overstaffing during slower periods.

Loyalty Program Performance
For brands leveraging loyalty programs through their kiosks, the dashboard provides critical metrics, including loyalty penetration rates (what percentage of orders include loyalty sign-ins), average check uplift from loyalty members, and revenue opportunity forecasting based on increasing loyalty adoption. This helps you quantify the ROI of your loyalty program and identify opportunities to drive enrollment.
Designed for How Operators Actually Work
The dashboard was built with flexibility in mind. Customizable date ranges let you analyze any time period—yesterday’s lunch rush, last month’s performance, or year-over-year comparisons. Location filters allow multi-unit operators to drill down into specific markets, franchisee groups, or individual stores.
Whether you’re a single-location owner checking daily performance or a corporate team managing hundreds of kiosks nationwide, the interface adapts to your needs.
What’s Coming Next
The current release focuses on kiosk channel analytics, but Bite’s product team is already working on expanded capabilities:
- Web and mobile ordering analytics to give you a complete picture across all digital channels
- Kiosk usage funnel analysis to understand where guests drop off in the ordering process and optimize the user experience
- Menu performance insights to identify top-selling items, underperforming SKUs, and upsell opportunities
Why This Matters Now
The restaurant technology landscape has evolved beyond simply automating transactions. Today’s operators need tools that help them understand their business, not just run it.
Kiosks generate thousands of data points every day—customer preferences, ordering patterns, peak times, promotional effectiveness. Without the right analytics tools, that data sits unused. With the Sales and Analytics Dashboard, Bite customers can transform that information into decisions that drive revenue, reduce costs, and improve the guest experience.
Getting Started
The Sales and Analytics Dashboard is now live for all Bite Admin users. To access it:
- Log in to your organization’s Bite Admin account
- Navigate to “Org Sales” in the main menu
- Start exploring your data
Questions about the Sales and Analytics Dashboard, or want to learn more about how Bite’s intelligent kiosk platform can grow your business? Contact our team or reach out to your Customer Success Manager.
-
Training Your Team for the Hybrid Service Model: A Practical Guide for QSR Operators
A newly hired team member walks in for their first shift, looks at the kiosks handling orders, and asks the question every operator hears: “So… what exactly do I do?”
It’s a fair question. The old service model was clear: greet, take order, process payment, hand off to the kitchen, deliver food. But the new model? That’s where many operators and their teams get stuck. Kiosks don’t eliminate hospitality roles—they elevate them. But only if you redesign your service model intentionally.
Operators who leave this to chance end up with staff standing around awkwardly while guests struggle with screens, or worse, employees who feel like technology is replacing them rather than empowering them. Those who build a deliberate hybrid model see higher satisfaction scores, better upsell performance, and lower turnover. And with the restaurant industry’s turnover rate exceeding 75% in 2025, getting this right isn’t just operationally smart—it’s financially critical.
The Role Redefinition That Actually Works
The biggest mistake operators make is implementing kiosks without redefining what their team does. When you leverage technology properly, your staff becomes more effective, not less relevant. Here’s the framework that creates clarity:
Three Core Roles in Hybrid Service
The Greeter/Navigator
This is your first impression setter. Your team member quickly assesses guest needs and directs traffic efficiently. At Bite, we call this role a Kiosk Ambassador. A simple “Welcome! Our kiosks make ordering super easy, but I’m here if you need anything” sets a positive tone for confident guests. For those who hesitate, a warm “First time using our kiosks? They’re really intuitive—let me show you” makes the technology feel accessible rather than intimidating.The Experience Enhancer
This role involves strategic support—watching for opportunities to add value where the kiosk can’t. According to industry research, 76% of kiosk-enabled restaurants reduced wait times while 67% increased check sizes. The kiosk handles intelligent upselling through its interface, but staff can layer in personalized recommendations: “I see you’re building a great meal—our signature sauce pairs perfectly with that, and the kiosk makes it easy to add.” This creates a powerful combination of technology efficiency and human insight.The Fulfillment & Connection Specialist
The handoff is where hospitality shines. While kiosks streamline ordering, this moment is all human—a quick quality check, eye contact, and “Enjoy your meal!” creates the memorable experience that builds loyalty. This is also when you catch issues before the guest leaves disappointed.Position-Specific Responsibilities
What kiosks excel at:
- Processing orders quickly and accurately
- Displaying full menu options with photos and nutritional information
- Suggesting intelligent upsells based on order patterns and data
- Handling payment efficiently with multiple methods
- Never forgetting to offer add-ons or promotions
What humans excel at:
- Reading guests’ body language and emotional cues
- Providing personalized recommendations based on conversation
- Creating genuine connections and memorable hospitality moments
- Adapting to unique situations and special requests
- Building regular relationships that drive loyalty
Collaborative opportunities:
- Staff guiding guests through kiosk features that match their preferences
- Using kiosk data to inform personalized service
- Technology handles routine tasks so humans can focus on hospitality
- Combining kiosk efficiency with human warmth for optimal experience
Overcoming Staff Resistance (Because It’s Real)
Technology anxiety is legitimate. When employee turnover costs average $5,864 per person—with training accounting for roughly $821 of that—you can’t afford to ignore the human side of implementation.
Common Fears and How to Address Them
“The kiosk is replacing me.”
This fear emerges because it’s what staff hear in headlines about automation. The reality? Research shows that 74% of operators say technology will augment rather than replace human labor. Frame it honestly: kiosks handle transactions so humans can handle hospitality. Your team shifts from order-takers to experience-makers, roles that are harder to replace and more fulfilling to perform.“I don’t know how to help guests with technology.”
Staff don’t need to be tech experts. They need simple troubleshooting scripts: “Sometimes it helps to tap a little harder” or “Let me restart this for you real quick.” Provide a one-page quick reference guide, not a technical manual. When staff feel equipped to handle common issues without calling for backup, confidence builds quickly.“This just creates more work.”
The learning curve is real, but temporary. Set clear expectations: the first two weeks will feel awkward, but by week three, the hybrid model actually reduces stress. When kiosks handle ordering complexity, staff can focus on what they do best—connecting with guests and solving problems.The Onboarding Approach That Works
Week 1: Shadow & Observe
Let new hires watch the hybrid model in action during different dayparts. Point out natural hospitality moments: “See how Sarah noticed that the guest was struggling and stepped in? That’s the role.” Build confidence before adding pressure.Week 2: Supported Practice
Role-playing common scenarios makes a huge difference. Practice the guest who can’t find the vegetarian options, the parent ordering for picky kids, and the regular who wants “the usual.” Side-by-side shifts with experienced staff create a safe space for mistakes.Week 3: Independent with Checkpoints
Solo shifts work when paired with structured feedback. Quick daily huddles on what worked and what didn’t help course-correct before bad habits form. Celebrating small wins—”You handled that kiosk freeze perfectly today”—reinforces the right behaviors.Getting Buy-In from Veterans
Experienced staff often resist harder than new hires because they’ve mastered the old way. The key is involving them in the process design. “You know this operation better than anyone—how should we position staff during lunch rush?” gives them ownership. Highlight how their expertise becomes more valuable, not less, when they’re freed from repetitive tasks to focus on complex situations that require experience.
Creating Clear Responsibilities & Accountability
Vague expectations create the “someone else will handle it” problem. Here’s how to prevent it:
Position Charts & Floor Maps
Visual layouts showing where staff should stand relative to kiosks during different dayparts eliminate confusion. Morning setup might have one person floating near kiosks, while dinner rush needs two. Map traffic flow patterns and create coverage zones so no guest is ever abandoned mid-order.
The 15-Minute Daily Huddle
This isn’t optional. Quick pre-shift meetings cover:
- What went well yesterday/what needs improvement
- Common guest questions from kiosk orders
- Upsell opportunities staff noticed
- One skill to reinforce (e.g., “Today, practice the soft approach: ‘Have you tried…’”)
Performance Metrics That Matter
For individual staff:
- Guest assistance interventions (quality over quantity)
- Order accuracy at pickup
- Upsell attachment rates during interactions
For the service model:
- Average time from arrival to order completion
- Kiosk abandonment rates
- Percentage of guests needing staff assistance
According to research on QSR operations, kiosk-linked loyalty programs can boost spend per order by 21% and overall loyalty engagement by 31%—but only when staff are trained to support the technology, not compete with it.
Advanced Training: Beyond the Basics
Once your team has the fundamentals down, these skills separate good hybrid service from exceptional:
Reading Kiosk Body Language
Signs a guest needs help (even if they don’t ask):
- Hovering a finger over the screen without touching
- Looking around for staff while standing at the kiosk
- Multiple back-button taps
- Rapid screen switching without adding items
Cultural and generational considerations matter too. Older guests may appreciate a proactive “Can I help you find something?” while younger guests often prefer space until they signal they’re stuck.
The Art of the Soft Upsell
Kiosk suggestions are algorithmic. Human recommendations are personal: “Since you’re getting the burger, a lot of our regulars love pairing it with the sweet potato fries—totally worth it.” That builds connection while increasing ticket size.
Handling System Downtime Gracefully
Technology fails. When it does, staff need backup protocols that maintain guest confidence. Simple pivot scripts work: “Our kiosks are taking a quick break—I can take your order right here and get you taken care of just as fast.” The key is practicing these scenarios before they happen, so staff don’t panic if and when the system freezes during lunch rush.
The Competitive Advantage of Great Hybrid Training
Operators who nail hybrid service training don’t just avoid awkward kiosk implementations—they create differentiation. In a market where technology is table stakes, the quality of human interaction becomes the lasting competitive edge.
The investment in training pays dividends:
- Lower turnover: With replacement costs for hourly staff averaging $2,305, keeping trained employees longer directly improves your bottom line
- Higher check averages: Skilled upselling at key moments can assist algorithmic suggestions
- Better guest retention: Memorable experiences beyond efficient transactions keep people coming back
- Smoother technology adoption: Teams confident with kiosks adapt more easily to future innovations
The operators winning in 2026 aren’t choosing between technology and hospitality—they’re training teams to deliver both seamlessly. That clarity, translated into structured training and clear responsibilities, transforms kiosks from operational necessity into a genuine competitive advantage.