Author: Corey Hines

  • The Multi-Unit Operator’s Guide to Peak Season Staffing

    The Multi-Unit Operator’s Guide to Peak Season Staffing

    Restaurant peak season staffing is one of those problems that looks like a headcount problem from a distance and a systems problem up close.

    Every summer, operators face the same math: more covers, more dayparts, more pressure — and the same constrained pool of available labor to cover it. The instinct is to hire more people. Sometimes that’s right. But the operators who consistently perform well during their busiest months aren’t just the ones who staff up the fastest. They’re the ones who think harder about where their people are deployed, how their systems absorb front-of-house pressure, and how they build a staffing model that doesn’t require everything to go right in order to hold together.

    Here’s what that looks like in practice.

    The Labor Market Doesn’t Get Easier in Summer

    According to the National Restaurant Association’s 27th annual Eating and Drinking Place Summer Employment Forecast, restaurants are projected to add 490,000 seasonal jobs this summer, making the industry the second-largest source of seasonal employment in the country, behind only construction. But the conditions operators are hiring into haven’t gotten friendlier

    The NRA’s 2025 State of the Restaurant Industry report found that 77% of operators say recruiting and retaining employees is still a leading challenge, and that pressure doesn’t ease when summer volume ramps up. The truth is, it compounds. Corporate sets the headcount budget and scheduling guardrails. Regional operators own the execution problem when those budgets don’t stretch to match what summer actually demands. 

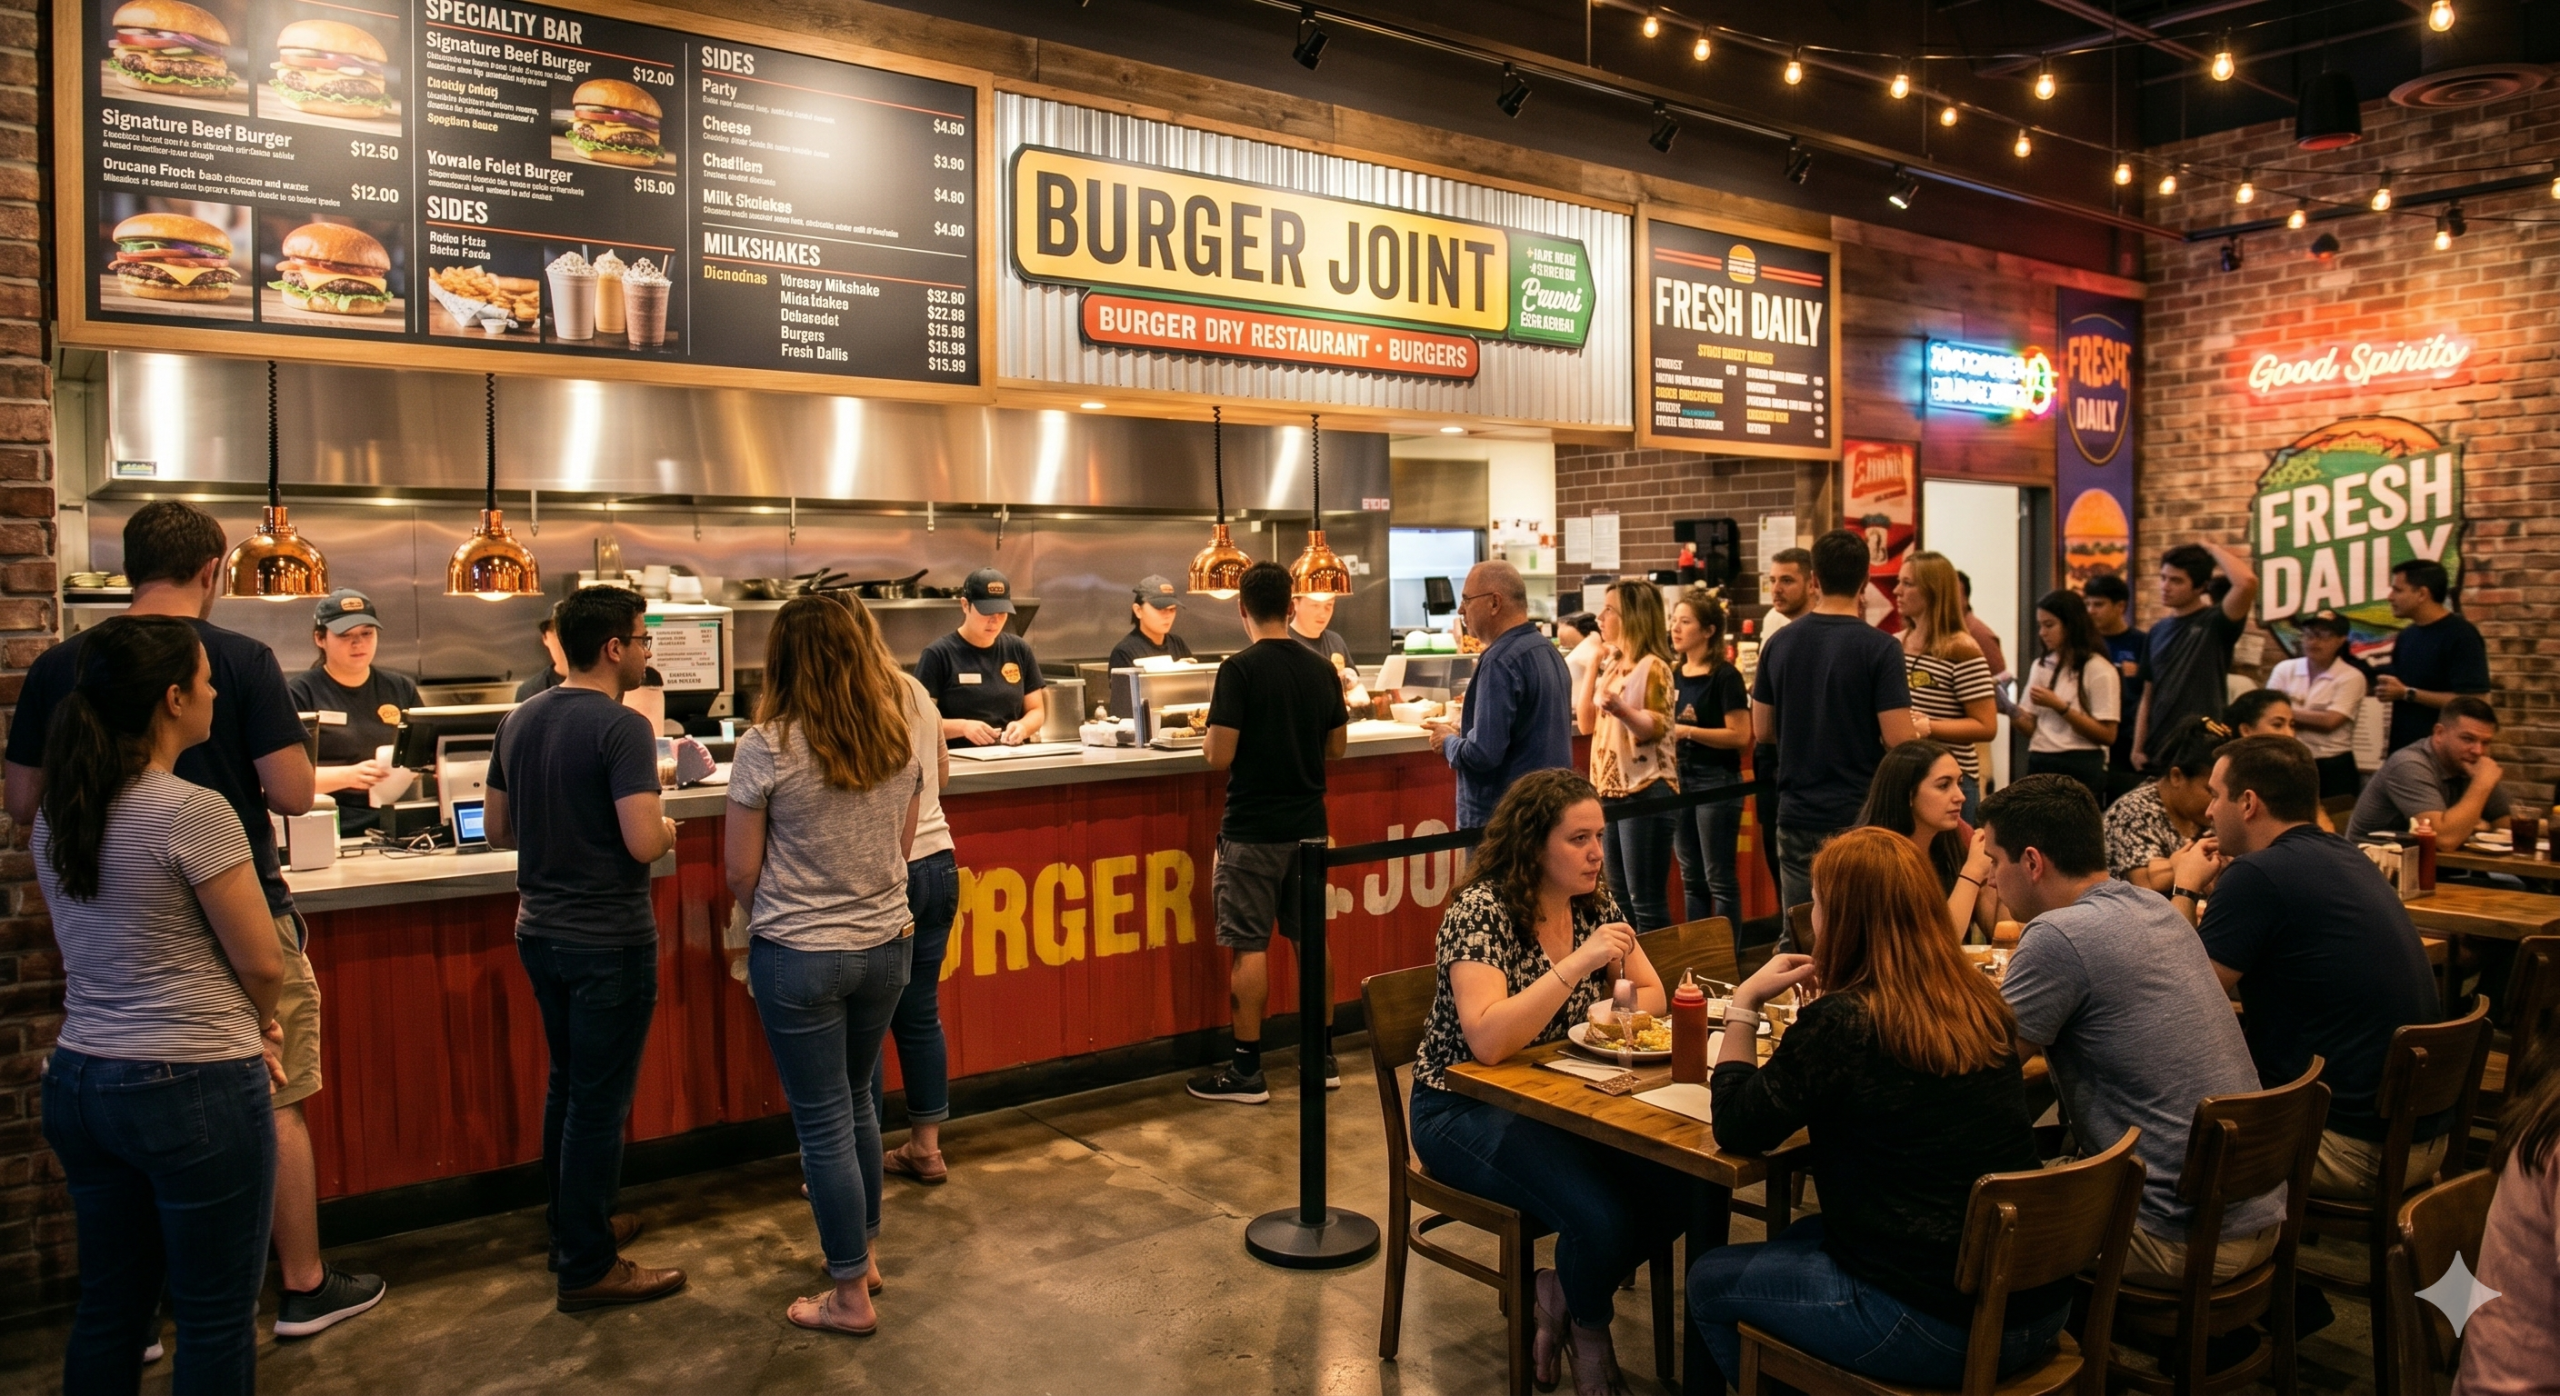
    The result is a familiar tension: more covers moving through locations that are already running lean, managed by a mix of returning staff and seasonal hires who are still finding their footing. The question at the end of the day is how to structure the operation so that it performs regardless of the challenges.

    Seasonal Hires Belong in the Right Roles, Not Just Available Ones

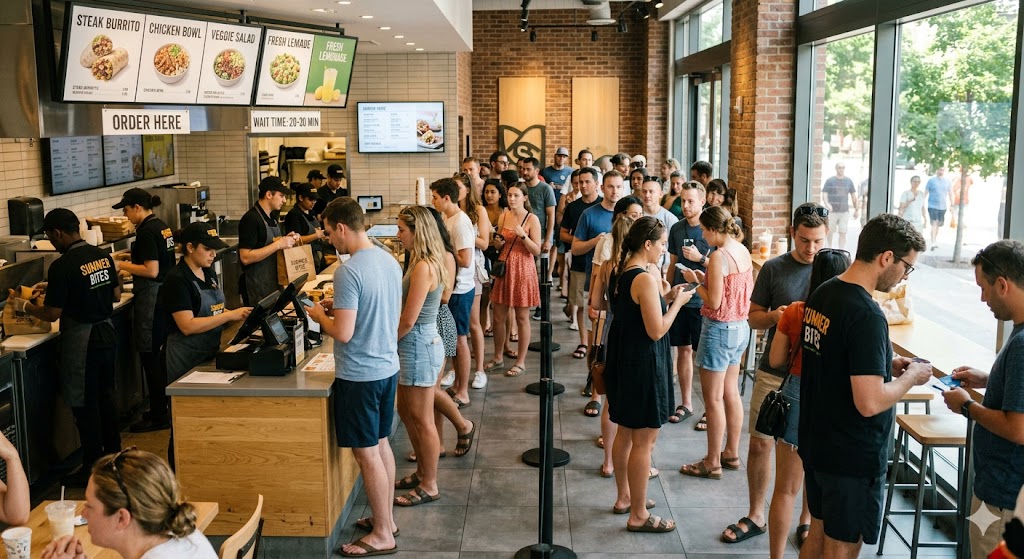
    Here’s a staffing mistake that plays out every summer across multi-unit operations: a new seasonal hire gets put on the register because that’s where the immediate coverage gap is. They’re slower, they make more errors, and every fumbled order adds to the line behind them.

    The instinct is understandable. You have a body, and you have a gap—you fill it. But new hires have the highest error rates and the steepest learning curves, and the register during a summer lunch rush is one of the highest-stakes, highest-visibility roles in the building. Putting inexperienced staff there doesn’t solve the throughput problem. It compounds it.

    The smarter deployment is to assign seasonal and newer hires to roles where the risk of error is lowest and the need for execution speed is highest: food running, bussing, expo support, lobby management. These roles contribute directly to throughput and guest experience without putting new team members in positions where a slow transaction or a misheard order backs up the entire front of house.

    That redeployment logic only works, though, if your experienced staff aren’t pinned to the counter. Which is where the technology question becomes a staffing question.

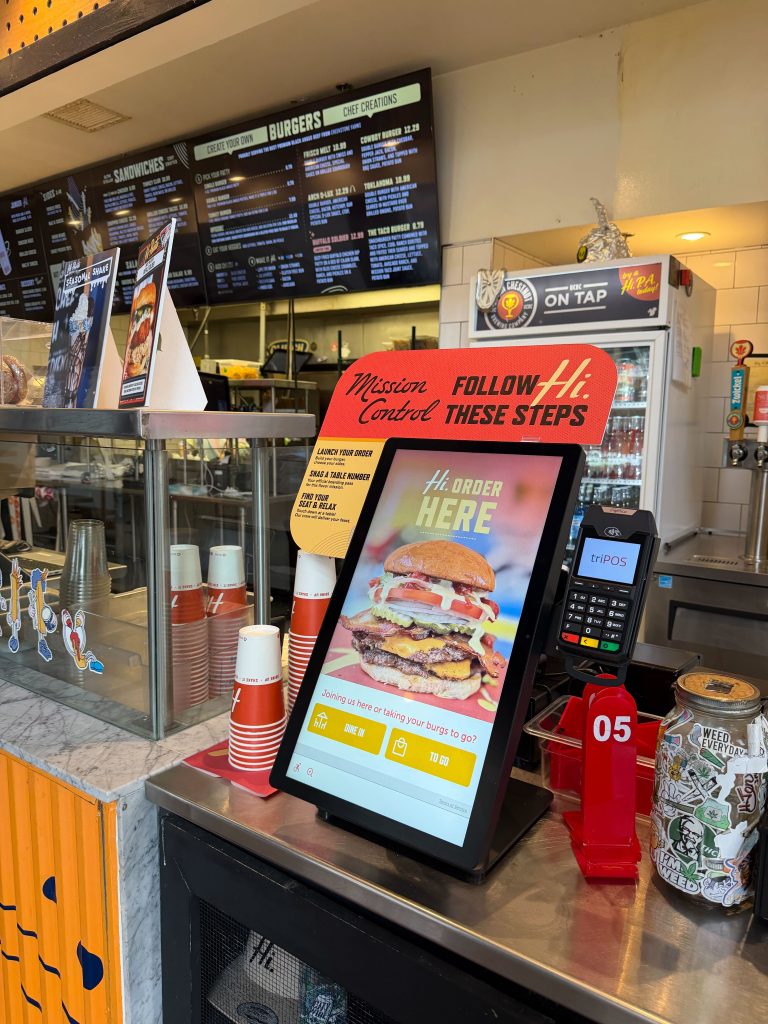
    Kiosks Change the Labor Equation at the Counter

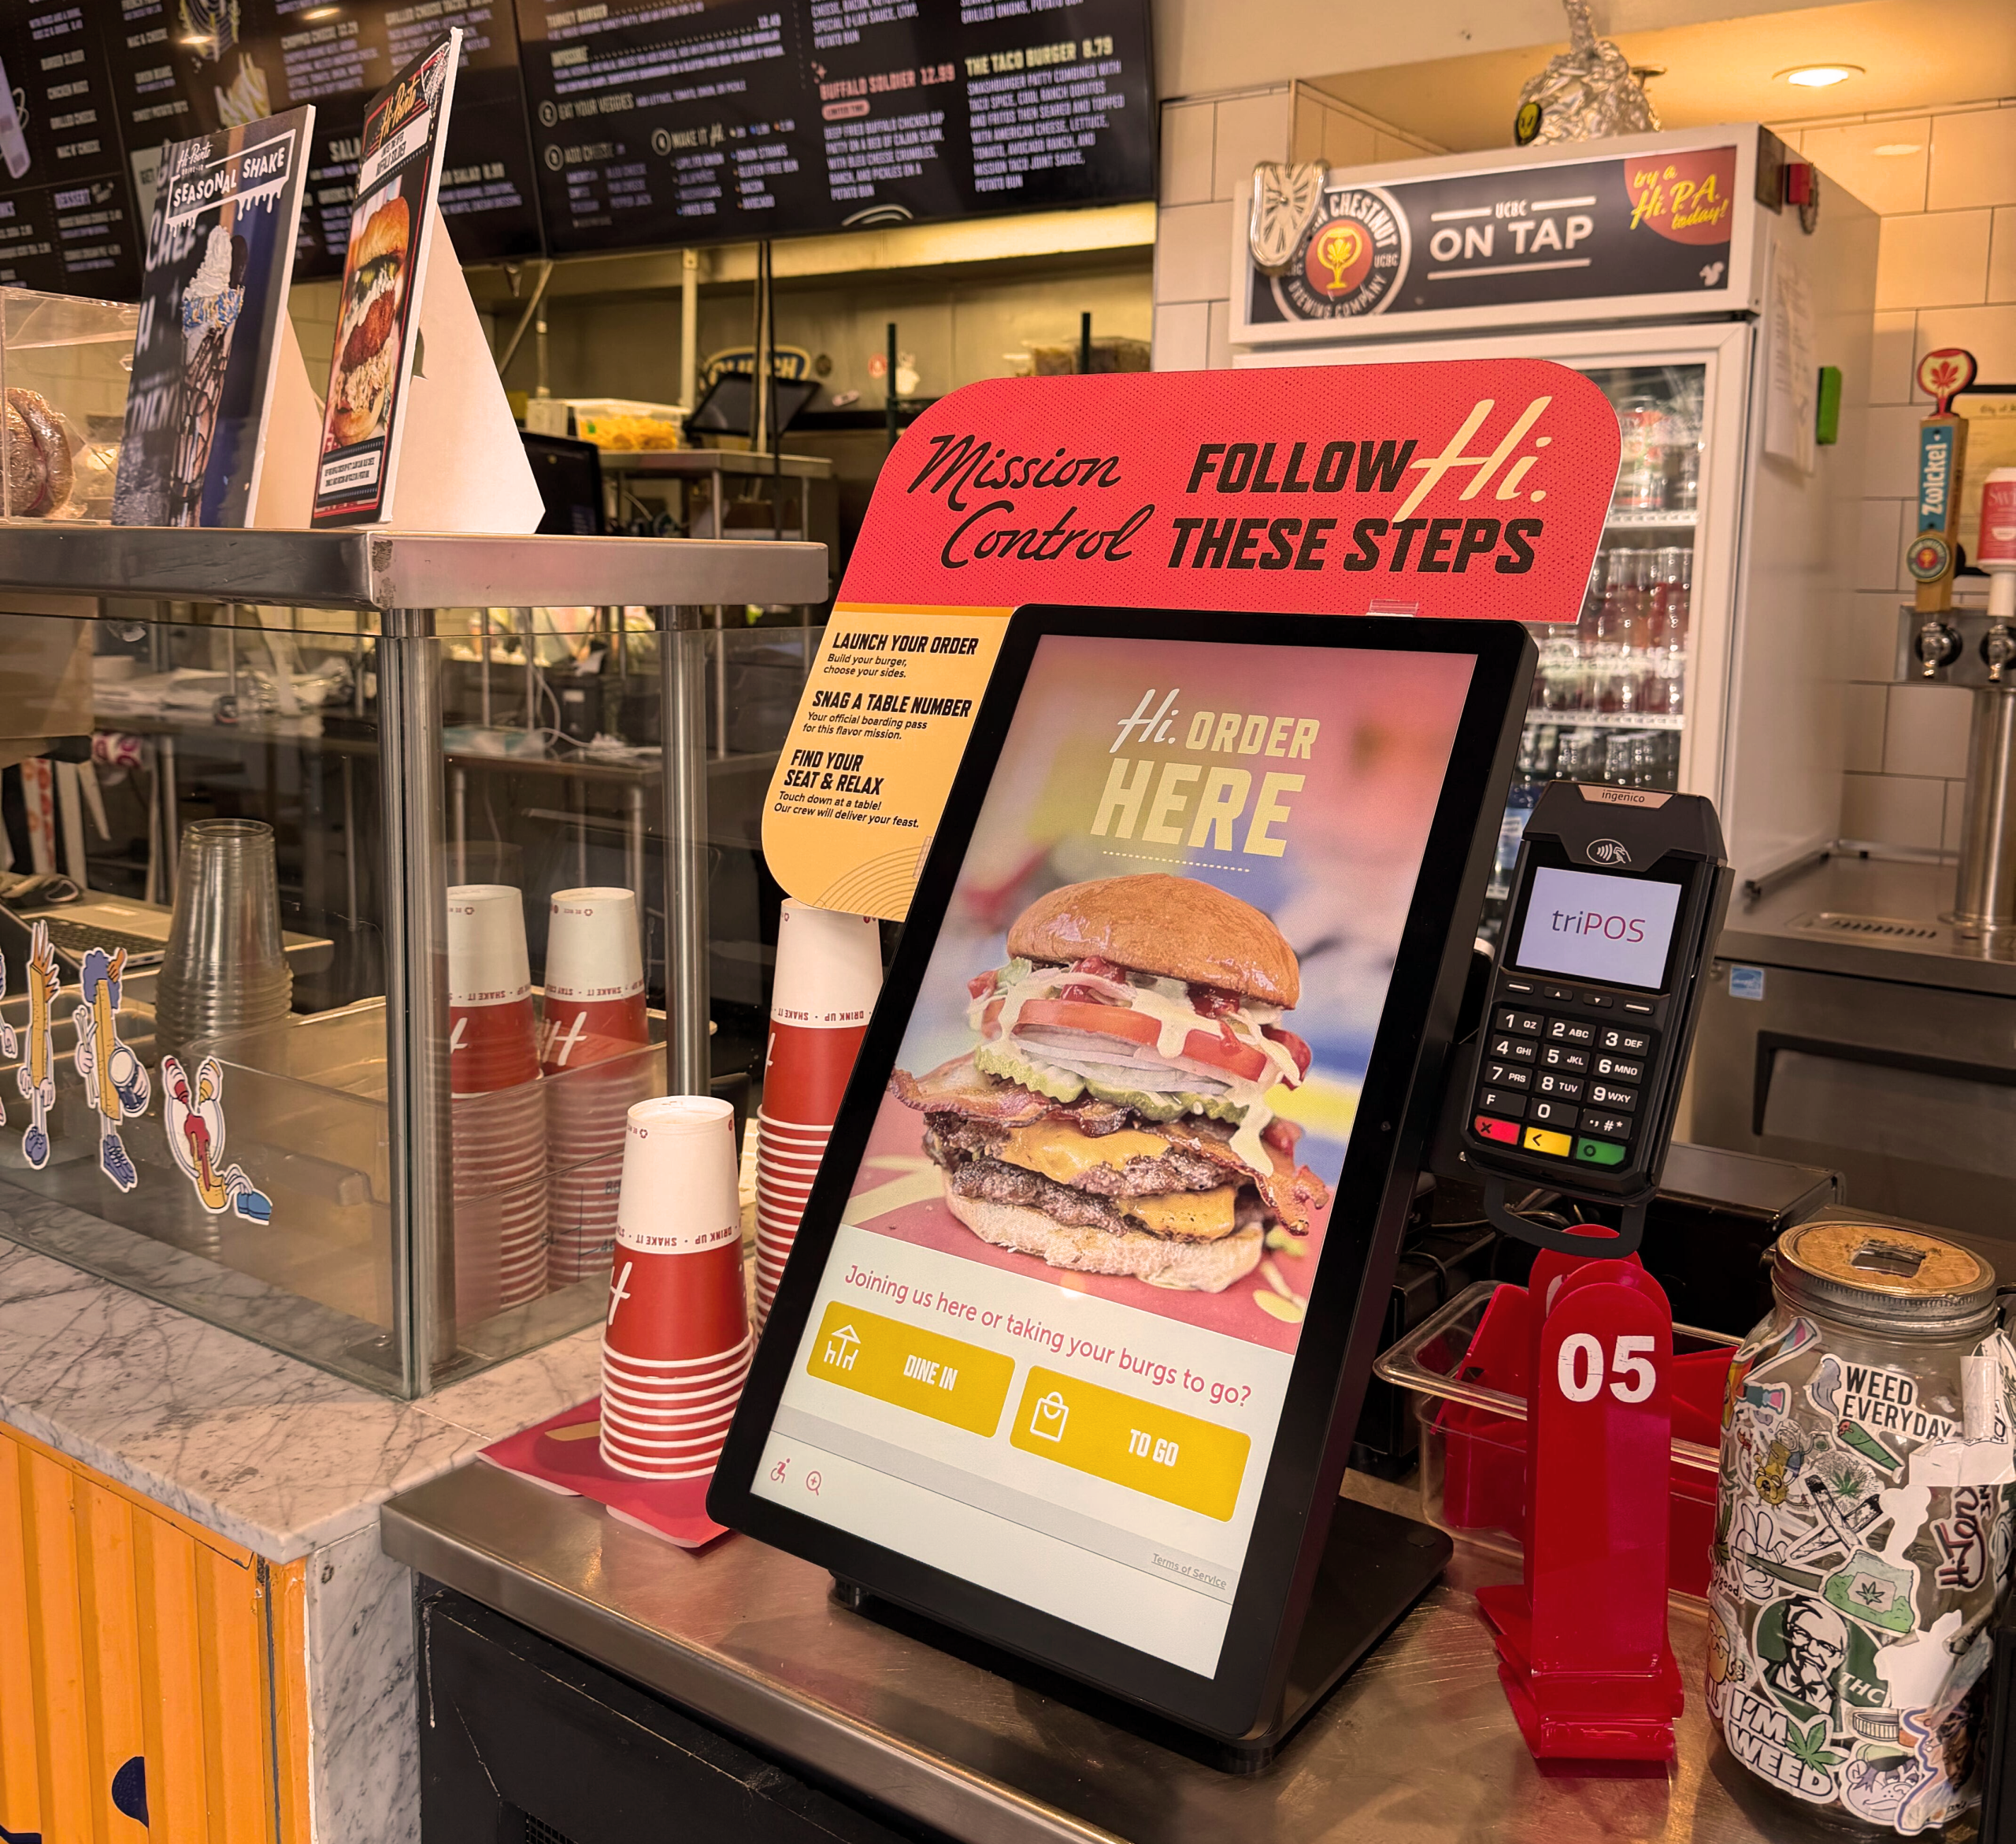
    When kiosks are handling a significant share of order intake, the staffing equation at the front of house shifts. Counter staff don’t disappear—they just move. And where they move is the decision that separates operators who get real leverage from their kiosk investment from those who just have kiosks in their lobby.

    According to Restaurant Dive’s coverage of major QSR kiosk deployments, restaurants that feature kiosks redeploy labor so employees can focus on preparing food, reducing the need for front counter staff to take orders. The value isn’t just labor reduction, it’s labor reallocation toward the roles that actually move throughput during a rush.

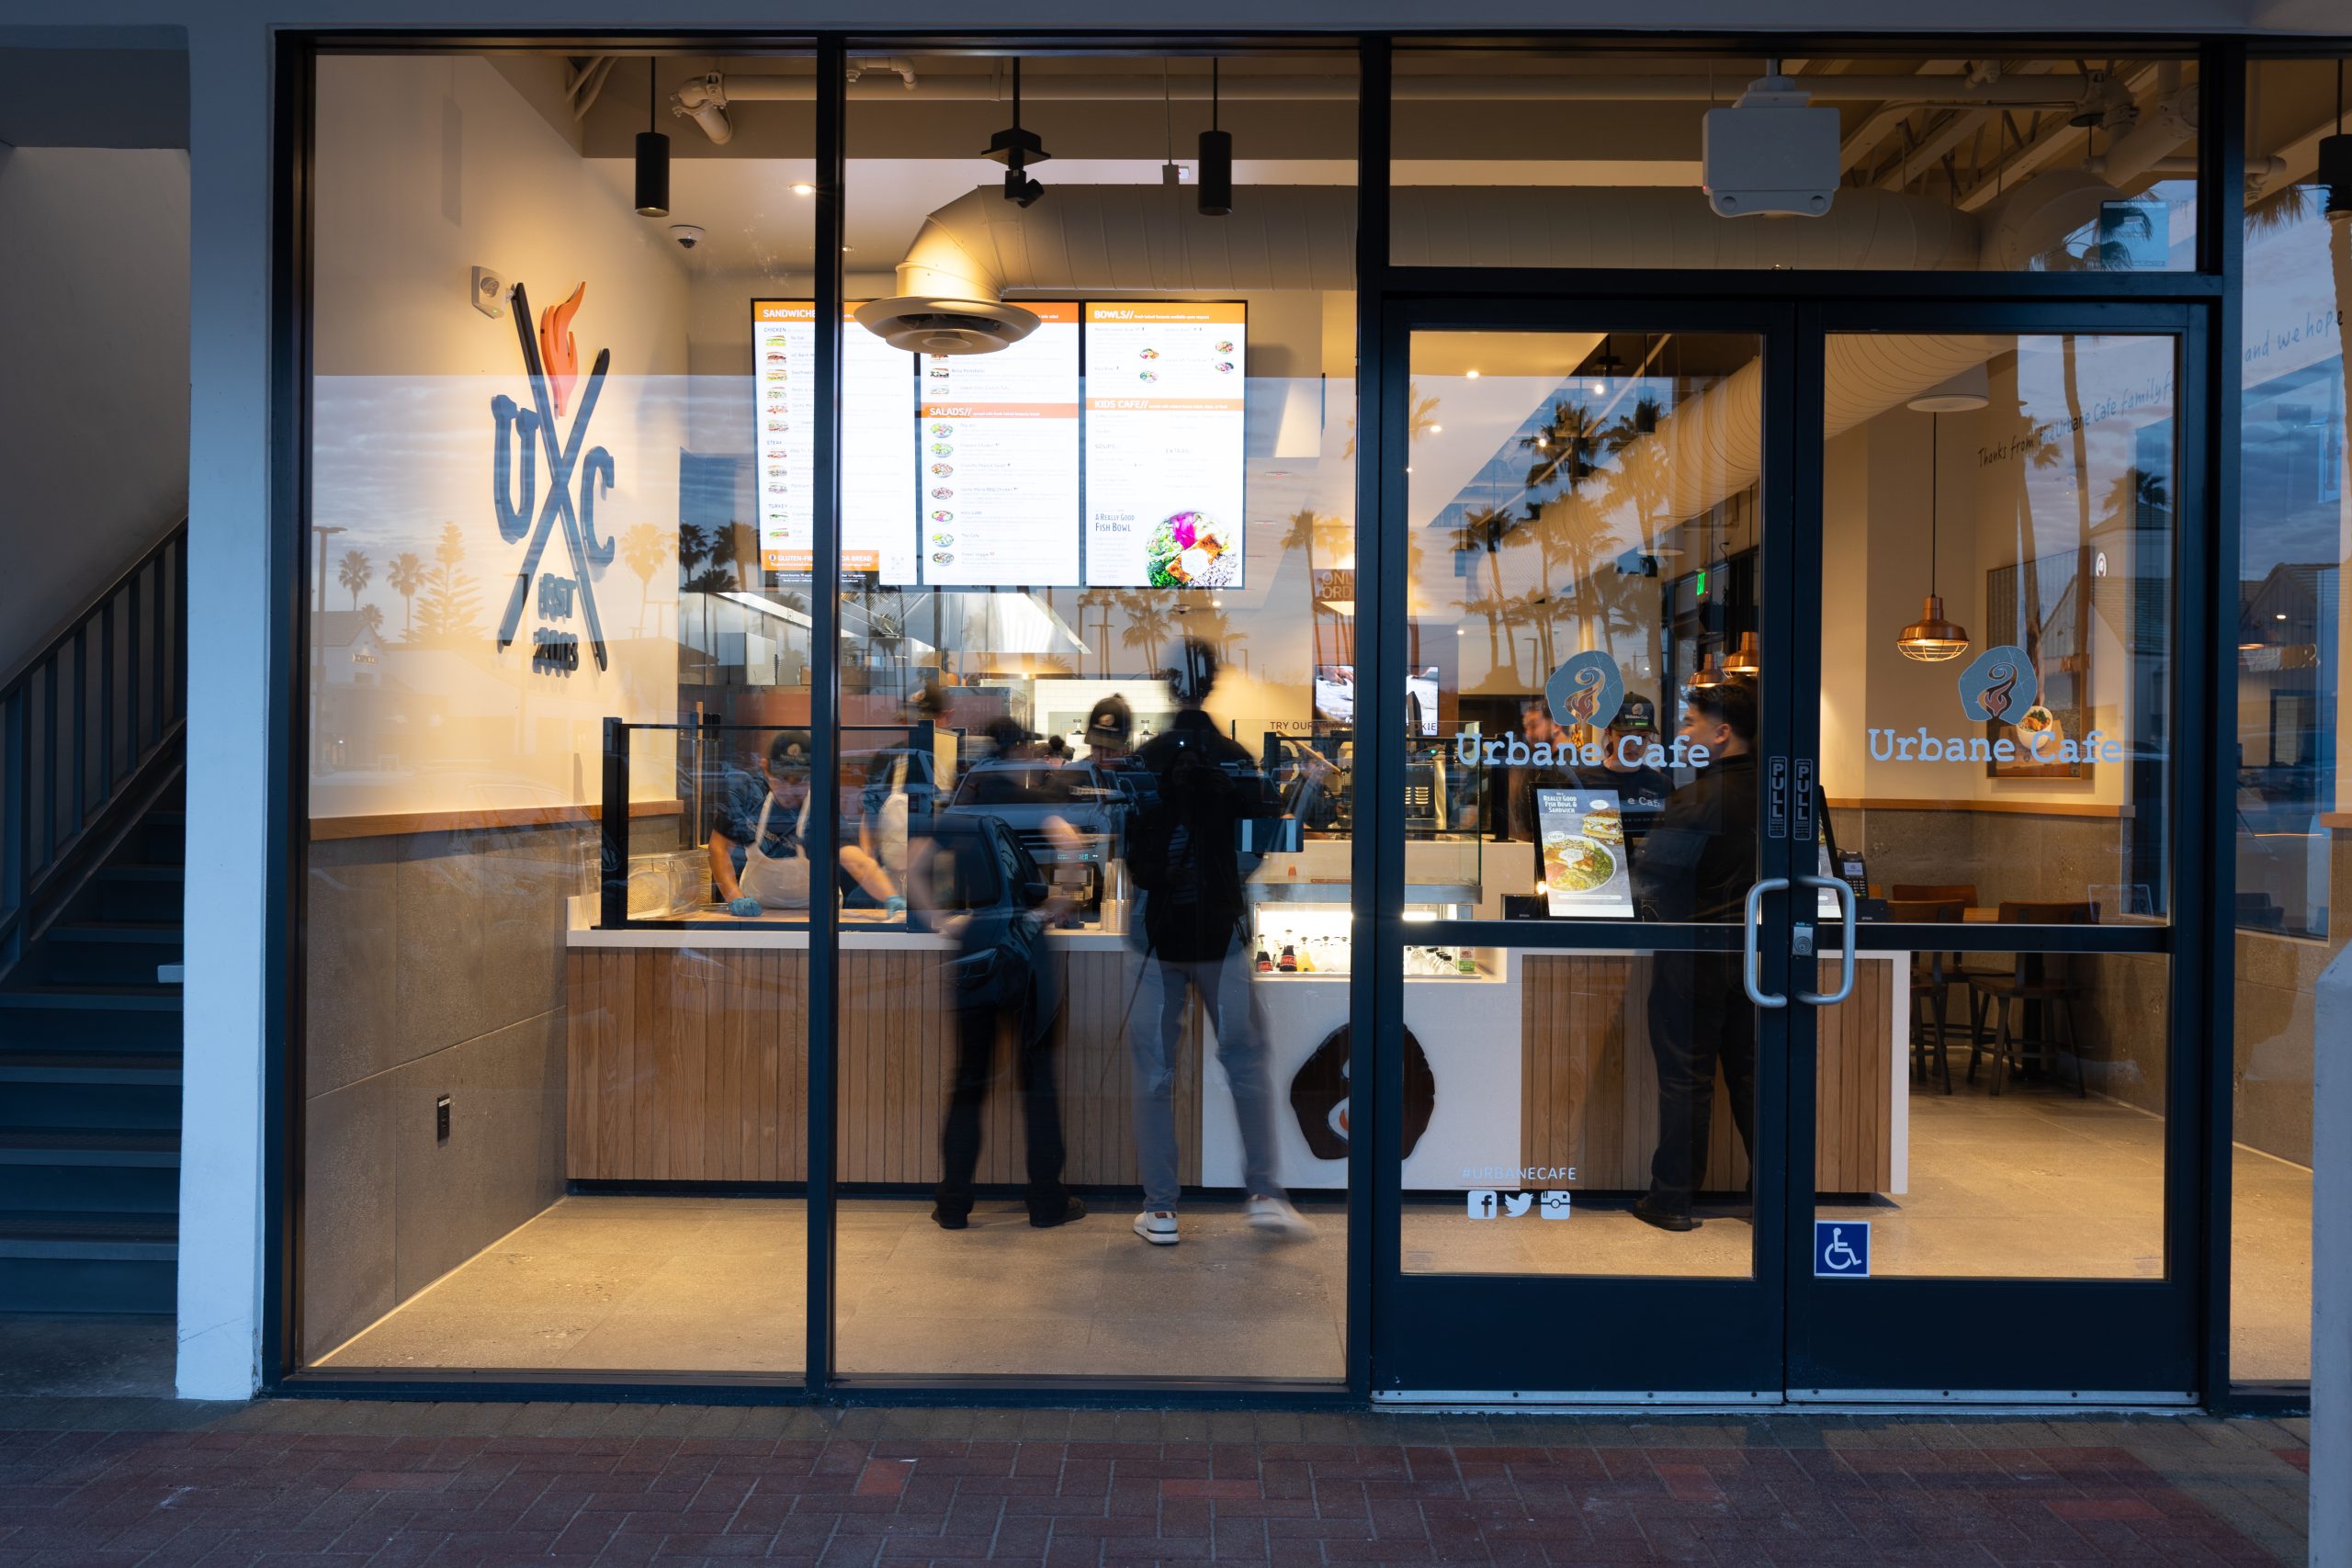
    Bite’s partnership with Urbane Cafe is a practical example of what this looks like at scale. Through their kiosk deployment, Urbane Cafe has been able to shift team members away from order-taking and toward the guest-facing hospitality roles that define the brand experience. It’s a reallocation in practice that makes a real-world difference in the guest experience and their bottom line. 

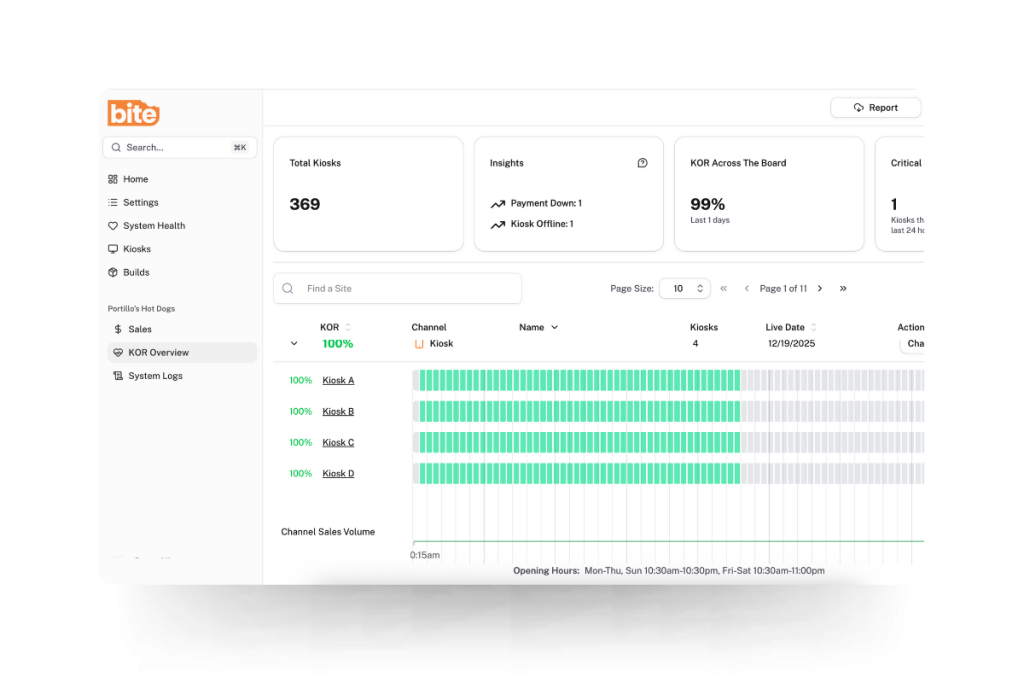
    There’s a compounding benefit during summer specifically: Bite kiosks deliver 99% order accuracy regardless of volume. During the weeks when your most experienced staff are stretched thin and newer hires are filling gaps, that consistency matters. 

    Cross-Train Before You Need To

    One of the clearest operational levers for peak season isn’t hiring, it’s preparation. With 77% of operators citing recruiting and retaining as a leading challenge, per the NRA’s 2025 State of the Restaurant Industry report, most operations are heading into summer already running below their ideal staffing depth. Cross-training is the primary way to build flexibility into a team that may not be at full strength when volume peaks.

    For multi-unit operators, the timing of cross-training matters as much as the practice itself. Cross-training done in May, before summer volume ramps up, builds the flexibility your locations need in July. Cross-training attempted during a peak rush is training under duress. It’s slower, less effective, and more likely to create the errors you were trying to prevent.

    The practical implication looks like this. Identify your highest-risk coverage gaps by location before peak season and run cross-training against those specific gaps. Which roles go sideways first when volume spikes? Which team members are closest to being capable in those roles with a bit of preparation? Those are the investments that pay off when it matters.

    Schedule Against Data, Not Last Year’s Anecdotal Memory

    Operators who build their peak season staffing plans around a general sense of “summer is busy” rather than actual daypart-level data are solving the wrong problem. Summer volume isn’t uniform. It’s specific. Tourist-heavy locations see patterns that commuter corridors don’t. Weekend dinner service in June looks different from weekday lunch in August. The locations that struggle during peak season are often the ones scheduled for average expectations rather than the actual demand their specific location and daypart combination generates.

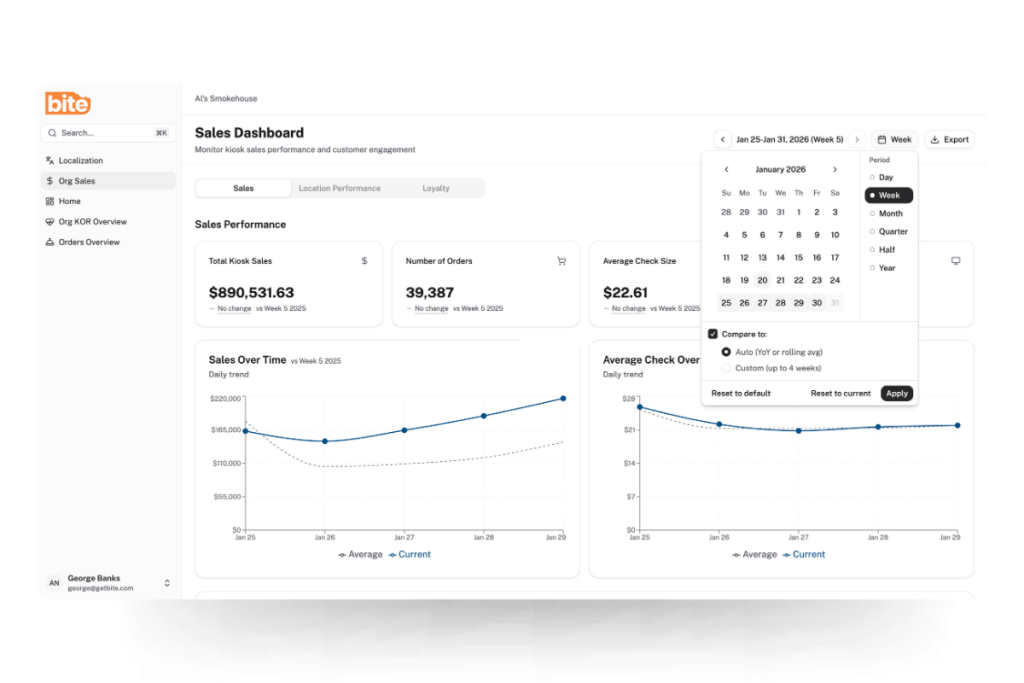
    Transaction data by location, day of week, and daypart is the most actionable staffing tool that most operators aren’t fully using. Where does ticket time consistently fall apart? Which locations are running thin coverage during their highest-volume windows? Which dayparts are generating more orders than the current staffing model can absorb cleanly?

    Bite’s Sales and Analytics Dashboard surfaces exactly this data—location-level and daypart-level transaction visibility that gives corporate and regional teams the information to schedule more precisely against actual demand. The goal isn’t to staff for the average week. It’s to staff for the hard weeks without blowing the labor budget on the easy ones.

    Build for the Hard Weeks, Not the Best-Case Scenario

    Peak season staffing plans that only work when everything goes right aren’t plans—they’re optimistic projections. Someone calls out. A seasonal hire doesn’t show. A location gets hit with an unexpected volume spike on a Tuesday. The operations that hold together under those conditions aren’t the ones with the most people on the schedule. They’re the ones with the most flexibility built into the model.

    That flexibility comes from a few places: cross-trained staff who can cover multiple roles without a full retraining cycle, kiosk coverage that doesn’t depend on who showed up that morning, and scheduling visibility that surfaces gaps before they become a problem on the floor. It also comes from being honest about where your single points of failure are—the roles, the locations, and the dayparts where one staffing problem tumbles into a guest experience problem.

    Peak season tests every part of your operation—staffing most of all. The operators who perform consistently during their busiest months have figured out that it’s not really a headcount problem. It’s a deployment, technology, and planning problem. Get those three things right, and the headcount you have goes a lot further.

  • Maximizing Revenue During Your Busiest Months

    Maximizing Revenue During Your Busiest Months

    Peak season fills seats. But filling seats doesn’t automatically mean better margins. For multi-unit operators trying to maximize restaurant revenue during peak season, that gap is where the real work happens.

    The operators who grow revenue during their busiest months have figured out something important: volume creates opportunity, but only if your systems are built to capture it. More covers moving through your locations generate more chances to grow the check, introduce a premium add-on, and push a high-margin item. Miss those moments consistently across hundreds of orders, across dozens of locations and you’ve left meaningful revenue on the table during the period you could least afford to.

    Here’s how the best operators close that gap.

    High Volume Is When the Human Upsell Breaks Down

    There’s a counterintuitive reality about peak season that most operators recognize but rarely address directly: the busier your locations get, the less reliable your staff-driven upselling becomes.

    When a line stretches to the door, and a team member is focused on moving guests through as fast as possible, suggestive selling is the first thing that goes. It’s not a training failure—it’s physics. A cashier managing a lunch rush doesn’t have the bandwidth to work through a thoughtful upsell opportunity for every order. They take the order, process the payment, and move on. It’s the right call for throughput. It’s a quiet revenue leak at scale.

    This is precisely why peak season is the highest-leverage moment for kiosk upselling. The kiosk doesn’t experience a lunch rush the same way a team member does. It surfaces the same well-configured upsell prompt on the 400th order as it did on the first, consistently, without fatigue, and without skipping steps when the lobby fills up. That consistency is where the revenue case for kiosk technology is most concrete.

    What Kiosk Upselling Actually Does to the Check

    The check lift data on kiosk ordering is well established at this point. Industry operators report average check increases from kiosks ranging from 15 to 30 percent, depending on whether the kiosk experience is optimized for speed of service or upselling, according to QSR Magazine’s coverage of operator deployment data. 

    The act is straightforward. Kiosks surface add-on prompts at the moment of highest purchase intent—after the main item is selected, and before the order is confirmed. They don’t rely on a team member remembering to mention the side, the upgrade, or the seasonal add-on. They do it every time, for every order, based on what the guest has already selected.

    Yum Brands CFO Christopher Turner said in a 2023 earnings call: “Kiosks not only drive a higher check compared to our traditional front counter, but also drive higher margins through operational efficiencies and generate new opportunities to leverage customer data and create personalized ordering experiences.” 

    Restaurant Dive’s coverage of that call is worth reading in full for the broader context on where major chains are placing their bets. 

    Bite operators consistently see 20%+ average check lift across their kiosk deployments—a figure that reflects both upsell attachment and the broader effect of guests spending more time with the menu when they’re in control of the ordering experience.

    The Upsell Logic Has to Be Built for Performance, Not Just Presence

    Not all kiosk upselling is equal. A kiosk that surfaces a random add-on, or promotes items without regard for contribution margin or prep time, isn’t capturing revenue—it just adds noise to the ordering experience.

    The configuration of the upsell sequence matters enormously. During peak season, when kitchen bandwidth is constrained and ticket time is a variable you can’t afford to ignore, the items you’re promoting at the kiosk need to pass two tests: they need to be high-margin, and they need to be fast. A summer LTO that takes four minutes to prep should not be the featured upsell during the lunch rush. A high-attachment add-on with a strong contribution margin that comes off the line in under a minute should be.

    This is the problem Bite Lift is built to solve. Rather than static upsell rules configured once and left alone, Bite Lift uses AI to match the right add-on to the right order at the right moment. It’s the difference between an upsell sequence that was smart at setup and one that stays smart as your menu, your traffic patterns, and your guest behavior evolve across the season.

    For multi-unit operators, the additional value is consistency. Upsell logic configured at the brand level performs the same way at every location.

    Use Your Peak Season Data Before the Season Ends

    Peak season generates more transaction volume than any other period, which means it also generates more data. Operators who aren’t actively mining that data mid-season are missing a competitive window that closes when traffic normalizes in the fall.

    The most actionable analysis is straightforward: pull your item-level sales mix, your upsell attachment rates, and your daypart performance by location. Look for the gaps. Which items are being promoted but underperforming on attachment? Which locations are seeing strong check lift and which aren’t—and what’s different about each? Which dayparts are converting on upsell prompts and which are seeing guests skip past them?

    Bite’s Sales and Analytics Dashboard surfaces this data at the org and location level, giving corporate and regional teams the visibility to make configuration adjustments mid-season rather than waiting for a post-mortem. The operators who come out of summer with better margins aren’t the ones who reviewed the data in September. They’re the ones who acted on it in July.

    Peak season is the highest-leverage moment to close the gap between traffic and revenue. The volume is already there, but are the systems configured to capture it on every order, at every location, across every daypart? If you’re ready to see what that looks like in practice, request a demo, and we’ll show you how Bite operators are doing it.

  • Aurus and Bite Partner to Help Merchants Turn Self-Service Kiosks Into a Higher-Value Customer and Operational Channel

    Aurus and Bite Partner to Help Merchants Turn Self-Service Kiosks Into a Higher-Value Customer and Operational Channel

    New York, NY — June 9, 2026 — Aurus Inc., a leading provider of payment orchestration and unified commerce solutions, today announced its partnership with Bite, a self-service kiosk platform designed by people who understand hospitality, where the goal isn’t just faster ordering, but a guest experience that keeps people coming back. At a time when artificial intelligence is becoming a larger part of customer engagement and store operations, Bite enables merchants to move beyond traditional self-service by using AI-powered recommendations to support upsell opportunities, improve order flow, and deliver a more intuitive guest experience. With Aurus integrated into Bite’s kiosk platform, merchants can now pair intelligent self-service ordering with secure, flexible, and scalable payment acceptance across multiple brands and locations.

    The partnership comes at a time when restaurant operators are under pressure to do more with less. Rising operating costs, labor constraints, uneven traffic, and changing guest expectations are forcing brands to rethink how they manage the front-of-house experience. For many merchants, the challenge is no longer whether to adopt self-service technology, but how to make it work in a way that improves customer experience, supports store operations, and delivers measurable long-term value.

    Self-service kiosks have become an increasingly important part of that strategy. Consumers are showing greater comfort with kiosk ordering, especially when it gives them more control, faster ordering, better customization, and the ability to review orders before payment while freeing staff to focus on the face-to-face service moments that define a brand’s hospitality. For merchants, that creates an opportunity to improve throughput, reduce ordering friction, support labor optimization, and unlock higher revenue opportunities through a more consistent digital ordering flow.

    The Aurus–Bite partnership is designed to support that shift by connecting Bite’s self-service kiosk experience with Aurus’ secure, scalable payment infrastructure. Together, the companies help merchants reduce friction between ordering and checkout, creating a smoother experience for guests and a more efficient operating model for brands.

    “This partnership is about more than connecting a kiosk to a payment system,” said Anil Raina, Senior VP-Client Relations. “Retailers are investing in self-service because they need faster ordering journeys, AI-driven personalization, stronger payment flexibility, and a clear return on operational change. By partnering with Bite, Aurus is helping brands make that transition with an intelligent payment experience that supports scale, reliability, and long-term business value.”

    For retailers, the value goes beyond the initial kiosk deployment. A well-integrated self-service experience can help reduce lines, increase ordering efficiency, and improve guest satisfaction. It can also support stronger ROI by creating more consistent upselling opportunities, improving labor allocation, and helping locations handle peak traffic more effectively.

    “Restaurants are evaluating every technology investment more carefully than ever, and kiosks are no exception,” said Brandon Barton, CEO of Bite. “What operators need isn’t just a self-service kiosk solution, it’s a complete experience that removes friction, drives check lift, and actually works at scale, while giving staff the space to focus on the genuine hospitality moments that keep guests coming back. Partnering with Aurus gives Bite customers a payment layer that matches the intelligence of the ordering experience, so brands can deploy with confidence, see a real return on investment, and build a front-of-house that’s better for both the business and the guest.”

    As restaurants continue to evaluate the cost and effort of technology conversion, the Aurus–Bite partnership gives merchants a stronger business case for self-service adoption. By improving the customer journey, increasing operational efficiency, and reducing friction at payment, Aurus and Bite are helping brands turn kiosk deployment into a strategic investment with measurable long-term impact.


    About Bite

    Bite is the leading kiosk ordering software for fast casual, quick-serve, and convenience store brands. Our patented AI technology, Bite Lift, analyzes every transaction in real-time to deliver personalized upsell recommendations—driving a consistent 20%+ increase in average check size. Trusted by innovative brands like Portillo’s, Del Taco, Love’s, and more, Bite combines deep customization with effortless deployment to improve order accuracy, increase throughput, and reduce operational costs. See why leading restaurant and c-store brands choose Bite. Visit getbite.com to learn more.

    About Aurus Inc.

    Aurus Inc. is a leading provider of payment orchestration and unified commerce solutions for enterprise retailers. With over 25 years of experience, Aurus enables secure, scalable, and flexible payment acceptance across in-store, online, mobile, and self-service channels. Its processor- and device-agnostic platform helps merchants reduce complexity, improve visibility, support multiple payment methods, and maintain greater control over their payment ecosystem.

  • Summer Success: 5 Ways to Handle Peak Season Traffic

    Summer Success: 5 Ways to Handle Peak Season Traffic

    Summer doesn’t sneak up on restaurants. Operators know the volume is coming weeks in advance. They staff up, prep more, and push harder. And yet every year, the same thing happens: lines back up, ticket times stretch, and guests who might have become regulars walk out the door before they ever place an order.

    The problem usually isn’t the kitchen. It’s everything upstream of it. Ordering infrastructure that was built for a normal Tuesday. Staff positioned where they’ve always been, not where peak volume actually needs them. Systems that work fine at moderate volume and quietly break down when covers spike.

    Multi-unit operators who consistently outperform during peak season aren’t just working harder. They’re running tighter systems. Here’s what that looks like in practice.

    1. Walk Your Locations Before the Rush Does

    The best pre-season investment costs nothing but time. Walk each of your locations during a simulated high-volume period, ideally when traffic is already elevated, and map what you see. Where do guests naturally slow down after entering? Where does the line form when the lobby gets full? Where does the ordering process visibly stall?

    This matters especially for locations with kiosks. A kiosk that sits to the side of the natural guest flow gets ignored. One positioned at the point where guests decelerate after entering captures orders before a counter queue ever forms. Placement relative to entry traffic patterns has a direct impact on adoption—and adoption is what drives throughput at scale.

    While you’re walking, evaluate signage and queue management too. These are consistently underdone. Guests who don’t know where to go don’t wait patiently while they figure it out, they get frustrated, they leave, or they create congestion that slows down everyone behind them.

    2. Let Kiosks Handle Order Intake at Volume

    Counter service has a structural limitation: it’s sequential. One guest orders, then the next. During a summer lunch rush, that constraint compounds fast.

    Kiosks break the sequential bottleneck by letting multiple guests order simultaneously. The throughput math is straightforward: Four guests ordering in parallel move through the system faster than four guests waiting in line. That difference is manageable at low volume and significant when covers spike.

    The industry has taken note. Shake Shack’s kiosks are now the brand’s largest and most profitable ordering channel, with kiosk checks running meaningfully higher than other in-store ordering channels—a result the chain attributed to smarter upsell sequencing through the kiosk experience. According to reporting from Restaurant Dive, a majority of QSR and fast casual guests now prefer kiosks over counter ordering when lines exceed four people—a figure that has grown significantly year over year.

    For multi-unit operators still evaluating kiosk ordering ROI, peak season is the clearest test case available. The volume is real. The staff constraint is real. The question is whether your ordering infrastructure can keep pace with both.

    3. Align Your Menu for Speed Before You Need To

    A menu that performs well at moderate volume can become a throughput liability when summer traffic hits. Complex modifier flows, items with long prep dependencies, and poorly organized category structures all slow down the order process at the kiosk, at the counter, and in the kitchen. The effects multiply when every station is running at capacity.

    Before peak season, run a practical audit. Which items drive the longest ticket times? Which modifications generate the most kitchen confusion or order errors? If you’re running summer LTOs, have those items been stress-tested at volume, or only at normal traffic levels?

    On the kiosk side, this translates to deliberate merchandising decisions: which items are promoted in featured slots, how modifier screens are sequenced, and whether your default selections reduce friction or add to it. Small adjustments to item placement and modifier flow can meaningfully reduce average order duration without any changes to the menu itself. Bite’s Sales and Analytics Dashboard gives operators the item-level data to make those calls with confidence rather than gut feel.

    4. Redeploy Your Team Toward Execution

    When kiosks are handling a significant share of order intake, the labor freed from the counter doesn’t disappear; it shifts. The operators who get the most out of that shift are intentional about where the capacity goes.

    The highest-value redeployment during peak season is toward execution: food prep, expo, and guest experience. These are the roles where speed and accuracy have the most direct impact on throughput and satisfaction, and they’re also the roles that get stretched thinnest when volume spikes. A team member who would otherwise be managing a register queue can instead focus on keeping the kitchen moving, which is where the actual bottleneck usually lives.

    QSR operators increasingly view kiosk deployment as a way to improve labor flexibility, not reduce headcount. It’s a framing that holds especially during summer, when you may be onboarding seasonal staff with limited experience. Limiting new hires’ exposure to high-stakes, high-error roles at the counter while kiosks handle ordering is a meaningful risk management decision, not just a staffing one.

    5. Build a Daypart Strategy Around Your Actual Peak Windows

    Not all summer volume looks the same. Tourist-adjacent locations see different traffic patterns than commuter corridors. Dinner daypart extends significantly in summer, particularly near outdoor venues, retail districts, and recreation areas. Weekend volume profiles can look almost nothing like weekday ones.

    Treating “summer” as a single operational condition misses the specificity that matters. Pull your transaction data by daypart, day of week, and location. Find where throughput consistently degrades—not just which locations are busy, but when and why the system slows down at each one.

    Peak season rewards preparation. Operators who treat summer as a systems problem—not just a staffing problem—come out of it with better margins, better guest scores, and an operational playbook that holds up well beyond Labor Day.

    If you’re evaluating how kiosk technology can support throughput and consistency across your locations, request a demo to see what Bite makes possible.

  • Faster Service, Higher Checks: What AI Kiosk Upselling Actually Does to Throughput

    Faster Service, Higher Checks: What AI Kiosk Upselling Actually Does to Throughput

    When operators evaluate AI upselling at the kiosk, a reasonable concern tends to surface early in the conversation: if the kiosk is prompting guests to add a side, upgrade a combo, or try a new LTO, doesn’t that add time to the order? And if it adds time to every order, doesn’t that create a throughput problem?

    It’s a fair question. One the data answers clearly.

    AI upselling at the kiosk doesn’t compete with speed. When configured correctly, it operates in parallel with it. Understanding why requires a look at where throughput actually improves in a kiosk-enabled environment—and what changes when order intake moves from the counter to a self-service channel.

    Where Kiosks Create Speed

    The throughput gains from kiosk ordering don’t come from eliminating the upsell. They come from shifting where order intake happens—and what that shift makes possible for the staff on the other side of the counter.

    When a kiosk handles taking orders, front-of-house staff are freed from managing verbal ones, clarifying customizations, and processing payment simultaneously under pressure during peak hours. That cognitive load doesn’t disappear, it gets redistributed to a channel that handles it more efficiently, while staff redirects their energy toward fulfillment, food quality, and the guest experience at the handoff point.

    The result is a more focused operation on both sides. Guests browse and order at their own pace without feeling rushed. Staff focus on what they do best. And the kitchen receives cleaner, more accurate orders that route directly from the kiosk without a verbal handoff that introduces errors.

    QSR Magazine’s analysis of next-generation restaurant formats found that three out of four kiosk-enabled locations outperformed their legacy counter-service counterparts on overall order accuracy scores—and that technology-enabled ordering drove speed improvements for digital orders placed for pickup. Accuracy and speed improved together, not at each other’s expense.

    Recent research underscores how sensitive the throughput economics actually are: reducing a customer’s wait time by just seven seconds can produce a 1% increase in sales. Every improvement in order flow efficiency has a direct, measurable revenue consequence. Which is why the operational shift that kiosks enable matters well beyond the technology itself.

    Why Order Accuracy Is a Throughput Metric

    One of the clearest throughput benefits of kiosk ordering is one that often gets framed as a guest satisfaction story: order accuracy.

    According to Qu’s 2025 State of Digital Restaurant Report, nearly 70% of enterprise restaurant brands cite order accuracy as their single biggest efficiency challenge. A 2025 QSR Drive-Thru Report adds important context: 62% of incorrect orders trace back to customization errors—precisely the kind of miscommunication that self-service ordering eliminates structurally, because guests input their own specifications rather than relaying them verbally.

    Every incorrect order is a throughput event. A re-fire consumes kitchen capacity. A refund or comp requires staff intervention. A remade order adds time to fulfillment for the guest who ordered correctly behind it. Accuracy improvements at the order-intake stage don’t just improve guest satisfaction, they reduce the operational drag that slows the entire fulfillment chain.

    In fact, order accuracy is demonstrably higher when guests place their own orders—a finding that reflects the straightforward logic of removing the verbal handoff from the equation entirely.

    The Upsell Prompt and the Order Flow: What the Data Shows

    The concern that upsell prompts add meaningful time to a transaction assumes that the prompts are interruptive, multi-step, or poorly designed. That assumption holds for a badly configured upsell flow. It doesn’t hold for well-built AI upsell logic.

    A well-configured prompt is a single, contextually relevant suggestion that appears at the natural moment in the ordering flow—after the primary item is selected, before payment. It takes a guest a second or two to accept or dismiss. It is not a negotiation. It requires no staff involvement. And because it’s integrated into the ordering sequence rather than appended to it, it doesn’t extend the transaction in any meaningful way.

    The more important comparison is not between a kiosk upsell and no upsell. It’s between a kiosk upsell and a human upsell at the counter. An Intouch Insight study found that digital channels executed upsell prompts 71% of the time, compared to 58–60% for human staff at the counter and drive-thru. 

    The reason? Human upselling is inconsistent by nature. Staff execute it differently depending on the shift, the volume, and their individual training and confidence level.

    The kiosk upsell doesn’t vary. It executes on every transaction without adding the interpersonal friction that can make counter-based upselling feel uncomfortable for both staff and guests.

    Check Average Lift: The Revenue Side of the Throughput Story

    The speed and accuracy benefits of kiosk ordering are well-established. Higher check averages are equally compelling, and the two outcomes reinforce each other rather than trade off.

    According to PAR Technology’s 2025 QSR Operational Index, kiosk check averages have grown faster than counter checks since 2021, outpacing counter check growth by a meaningful margin. The report attributes this directly to the consistent upsell execution that digital ordering enables—a finding that echoes across the industry.

    Restaurant Dive’s reporting on Shake Shack’s kiosk performance captures the dynamic clearly: the company’s kiosk channel now accounts for over half of its in-restaurant sales. CFO Katie Fogertey has credited deliberate investment in upsell configuration, offering contextual prompts for additions like an extra patty or bacon, as a key driver of kiosk checkout performance versus the counter. Shake Shack’s results were not a byproduct of the technology alone. They were the result of thoughtful configuration of that technology.

    For brands that partner with Bite for their kiosk operations, the pattern is consistent. Crazy Bowls & Wraps, a fast casual chain that implemented kiosks using Bite Lift, reported a 38% increase in average order value—a result that reflects what well-configured AI upsell logic delivers when it’s built around the items and moments that actually move the needle on margin.

    “Our partnership with Bite has been awesome. Our check averages for orders placed on the kiosks increased by 38%. We’ve also been able to reallocate our labor to better enhance the guest experience, resulting in a substantial improvement in our order accuracy.” — Kim Reitzner, Former COO of IT, Crazy Bowls & Wraps

    The mechanism behind the lift is straightforward. Guests browsing at a kiosk encounter high-margin items with visual merchandising, clear pricing, and a low-friction path to adding them. They make that decision without the social pressure of a line behind them or the time pressure of a staff member waiting for a response. QSR Magazine notes that order accuracy and check size both improve when guests place their own orders and that kiosk orders consistently carry a higher margin than counter orders because the experience is designed to surface higher-margin items alongside the primary order.

    Configuring for Both Speed and Revenue

    The operators who see the strongest combined throughput and check average results from kiosk upselling share a few common configuration principles.

    Daypart awareness. Effective AI upsell logic reflects the purchasing behavior of the daypart. A breakfast prompt looks different from a dinner prompt in the items suggested, the visual presentation, and the price point. Generic upsell logic that doesn’t account for daypart performs below its potential on both conversion and relevance.

    Prompt depth discipline. A single, well-placed suggestion outperforms three sequential prompts on every meaningful metric: conversion rate, perceived order speed, and guest experience. The goal is one frictionless moment of discovery per transaction, not a series of interruptions that make guests feel like they’re navigating an obstacle course.

    Visual merchandising quality. High-quality imagery, clear pricing, and a single-tap acceptance path reduce both hesitation time and decision friction. When the visual presentation does the work, guests make faster decisions, which benefits both throughput and attachment rate simultaneously.

    The Portfolio-Level Case for Consistent Execution

    For a multi-unit franchise operator, the throughput and revenue arguments converge on a single outcome: consistency across locations.

    A kiosk executes the same upsell logic on every transaction, at every location, across every shift. It doesn’t have an off day. It doesn’t skip the prompt when the lunch rush is heavy. It doesn’t execute differently at location 6 than it does at location 22. The performance that a well-configured kiosk delivers at your best location is the same performance it delivers at every location in the portfolio.

    That consistency compounds significantly at scale. Across daily transaction volume, across 20 or 30 locations, across a full operating year, the revenue difference between consistent AI upsell execution and variable human-dependent upselling is substantial. Even when the per-transaction lift is modest.

    The throughput gains compound the same way. Fewer order errors means fewer re-fires system-wide. Cleaner order intake means more efficient kitchen routing across the portfolio. Staff freed from order-taking means a more focused fulfillment operation at every unit, every shift. For operators who want to understand what that looks like in practice, request a demo to walk through your specific operation.

  • Same Kiosk, Different Results: What’s Really Driving Performance Variance Across Your Locations

    Same Kiosk, Different Results: What’s Really Driving Performance Variance Across Your Locations

    For most QSR and fast casual franchise systems, the decision to implement kiosks is made well above the operator level. Corporate selects the hardware, negotiates the vendor agreement, architects the menu, and communicates the brand standard. The franchisee’s job is to deploy and execute.

    So when kiosk performance varies significantly across a portfolio—when location 6 is driving strong check average lift and location 19 is falling short—the instinct is to look at the technology. Same vendor. Same software. Same corporate configuration.

    More often than not, the technology isn’t the issue—the execution is.

    For multi-unit franchise operators managing 10, 20, or 30-plus locations, execution variance is one of the most underexamined sources of revenue gap in a portfolio. It doesn’t show up as a catastrophic failure. It shows up as check averages that never quite reach their potential, upsell attachment rates that are inconsistent across units, and kiosk adoption numbers that tell very different stories depending on which location you’re looking at.

    According to QSR Magazine, nearly 70% of enterprise restaurant brands cite order accuracy as their biggest efficiency challenge—a number that has grown year over year as kiosk deployments have scaled. The brands gaining ground are the ones treating efficient kiosk execution as a strategic priority rather than a day-one deliverable.

    Corporate Designs the Experience. The Franchisee Owns the Outcome.

    This is the central tension in franchise kiosk deployments, and it’s worth stating plainly.

    When corporate works with a kiosk software vendor to engineer the upsell logic, the promotional sequencing, and the menu architecture, they’re building toward a revenue and margin model that assumes consistent execution across the system, where every location is running the same configuration, driving the same attachment rates, and delivering the same check average lift. At least in theory.

    That assumption is almost never fully realized in practice. And the franchisee absorbs the gap.

    The reasons cluster around three operational realities that don’t get enough attention in conversations about kiosk technology: 

    1. Physical placement
    2. Menu and configuration accuracy
    3. Kiosk health

    Each one is invisible in aggregate reporting. Each one compounds quietly across a portfolio. And none of them get resolved without the right combination of operational discipline and technology infrastructure.

    The Physical Execution Problem

    The most overlooked variable in kiosk performance is also the most visible: where the kiosk is, and whether guests know to use it.

    A kiosk placed near the entrance, at natural eye level, with clear signage directing guests toward self-order, will drive materially different adoption than a kiosk positioned in a corner of the dining room with no wayfinding. Both units may have identical software configurations. One location’s kiosk is generating transactions throughout the lunch rush. The other is being largely ignored by guests who defaulted to the counter because nothing pointed them elsewhere.

    This isn’t a hypothetical. Placement and adoption signage are among the most common differentiators between high-performing and low-performing kiosk locations in a franchise system. A location where staff actively direct guests to the kiosk, where floor signage is current and well-positioned, and where the kiosk is physically integrated into the natural flow of the space will consistently outperform one where the kiosk exists as an afterthought in the layout.

    This shows up in adoption rates. And adoption is the prerequisite for everything else the kiosk is supposed to do—the upsell logic, the check average lift, the labor reallocation. None of it matters if guests aren’t using the kiosk in the first place.

    Menu & Configuration Accuracy Problem

    Even when corporate has worked to ensure upsell logic is done correctly, what’s running at any given unit can diverge from that standard over time.

    A menu update rolls out but doesn’t propagate cleanly to every location. An LTO launches and two units in the portfolio are still running the previous promotional sequence. A price adjustment is made at the POS level, but isn’t reflected on the kiosk interface. None of these are dramatic failures, but each one represents a measurable gap between what corporate intended and what the guest actually experiences.

    As industry reporting on QSR menu management notes, in multi-unit operations with frequent promotions and regional pricing, manual update processes introduce delays, errors, and configuration drift that compound across locations over time. A single missed update at a handful of units—incorrect pricing during a promotional period, an LTO that launched late—creates brand inconsistency, franchise disputes, and direct margin loss.

    The Kiosk Health Problem

    There’s a failure mode that’s even more basic than configuration drift—and often just as invisible: the kiosk that’s down, frozen, or underperforming, and nobody knows about it.

    QSR Magazine’s coverage of hidden technology costs puts the stakes plainly: when restaurant technology fails, the cost isn’t just in lost transactions, it’s in labor workarounds, damaged guest experience, and brand perception that erodes transaction by transaction. A kiosk that goes offline during the lunch rush, or that appears operational but is frozen on a loading screen, is generating zero revenue while appearing on paper as an active asset.

    The problem isn’t always dramatic. A kiosk can be technically powered on but stuck in an incorrect mode. It can be processing orders at a fraction of its typical volume because a connectivity issue is slowing the interface. It can have been quietly switched off by a staff member who found it easier to redirect guests to the counter. In any of these scenarios, the location is underperforming, and without real-time monitoring, no one at the operator or corporate level knows until they look at the end-of-month numbers and see the gap.

    For a multi-unit franchisee, the lag between a kiosk going down and someone noticing is a direct revenue leak. Multiply it across a fleet of locations over the course of a year, and the cumulative impact is substantial.

    Closing the Gap: What the Right Infrastructure Makes Possible

    These three problems—physical placement variance, menu and configuration accuracy, and kiosk health gaps—share a common characteristic: they’re all invisible without the right reporting and monitoring infrastructure in place.

    Closing them requires two things to work in parallel: proactive uptime monitoring at the kiosk level, and portfolio-level performance visibility that helps operators and corporate teams see what’s actually happening across the system.

    Real-time kiosk monitoring: Bite’s KOR (Kiosk Order Ready) Dashboard

    KOR is Bite’s real-time kiosk monitoring system, designed to surface kiosk health issues before they compound into meaningful revenue loss. KOR continuously monitors each kiosk in a fleet for connectivity, operational status, and order flow. When a kiosk goes offline, experiences a hardware issue, or stops accepting orders, KOR immediately sends an alert—via SMS or email—to designated contacts, whether that’s the store manager, a regional operator, or a corporate IT team.

    The operational value is straightforward: rather than discovering a kiosk was down for three hours after the fact, operators can act on issues in real time, minimizing downtime and protecting the revenue the kiosk was deployed to generate.

    Portfolio-level visibility: Bite’s Sales & Analytics Dashboard

    Uptime monitoring addresses acute issues. Portfolio-level reporting addresses the chronic ones—the performance variance that accumulates quietly across locations over weeks and months.

    Bite’s Sales & Analytics Dashboard gives both corporate teams and individual franchise operators a clear view of what’s actually happening across kiosk-enabled locations. Corporate sees the full system—total sales, average check sizes, order volume, and location-level performance across the entire footprint. Individual franchisees see the same depth of insight scoped to their own units.

    The features that matter most for closing execution gaps:

    Location-level comparison. The dashboard makes it straightforward to identify top-performing locations and understand what’s driving their results—and to flag underperforming locations that may need operational attention. A location consistently running below system average on check size or attachment rate is a signal worth investigating. Is it a placement issue? A configuration gap? A staffing behavior driving guests to the counter? The data surfaces the question; the operator can then go find the answer.

    Hour-by-hour order trends. Breaking down order volume by hour gives operators the data to optimize staffing and identify peak-period performance gaps. A kiosk that should be driving strong lunch volume but shows a mid-shift drop-off may have experienced an issue KOR already flagged—or it may reflect a staffing or placement dynamic that requires a different kind of intervention.

    Promotional and LTO performance tracking. Filtering by date range allows operators to evaluate kiosk performance during specific promotional periods, seasonal peaks, or new menu rollouts—and to compare current performance against any historical period to identify whether configuration changes are having the intended effect.

    Loyalty program metrics. For brands leveraging loyalty through their kiosks, the dashboard surfaces loyalty penetration rates, average check uplift from loyalty members, and revenue opportunity forecasting based on increasing loyalty adoption. This gives operators a quantified view of the ROI their loyalty program is generating at the kiosk level.

    Together, KOR and the Sales & Analytics Dashboard address both ends of the execution gap problem: the acute issues that need immediate response, and the chronic variance that requires systematic visibility to diagnose and close.

    What the Data Makes Visible

    Consider what changes for a regional franchisee operating 20 locations when this infrastructure is in place.

    Location 14 shows up in the dashboard as consistently below the system average on average check size. KOR has logged two brief outage events in the past month, both resolved within minutes of the alert. But the check average gap persists even when the kiosk is fully operational, which points toward a placement or adoption issue rather than a technical one. The operator visits the unit and finds the kiosk tucked against a side wall with no directional signage, while guests queue at the counter out of habit.

    That diagnosis—and the fix—would have been invisible without portfolio-level reporting. The location would have continued to underperform, the revenue gap would have continued to compound, and the cause would have remained unknown until someone happened to notice it on a site visit.

    This is what the right technology infrastructure makes possible. Not just kiosks that take orders, but visibility that allows operators and corporate teams to ensure those kiosks are performing as the system was designed to perform.

    The Rollout Is the Beginning, Not the End

    For franchise operators in QSR and fast casual, the kiosk is increasingly a baseline expectation—from corporate, from guests, and from the competitive landscape. What differentiates operators going forward isn’t whether they have kiosks. It’s whether those kiosks are performing consistently across every unit in the portfolio.

    The gap between a well-executing kiosk deployment and an average one isn’t usually a technology gap. It’s a placement gap, a configuration gap, a health monitoring gap, and a visibility gap. Closing all four is what turns a kiosk rollout from a capital line item into a sustained margin driver.

    Bite’s platform is built to support that full lifecycle—from real-time kiosk monitoring to portfolio-level performance visibility. If you’re ready to see what consistent, system-wide kiosk performance looks like in practice, request a demo today.

  • How QSR & Fast Casual Can Grow Check Averages Without Raising Prices

    How QSR & Fast Casual Can Grow Check Averages Without Raising Prices

    The math is familiar: food costs are up, labor costs are up, and the consumer on the other side of the counter is increasingly resistant to paying more. For QSR and fast casual operators, the instinct is to raise prices—but that instinct is now running headfirst into a market that has started to push back hard.

    According to Placer.ai, lower- and middle-income consumers have been pulling back from QSR and fast casual chains they perceive as expensive, shifting their spend toward value grocers, warehouse clubs, and convenience stores. Research indicates that 44% of lower-income consumers are dining out less than they did the prior year. One QSR analyst describes this moment as fast food having “crossed a psychological threshold”—what was once perceived as an affordable option no longer is for many households.

    For a multi-unit franchisee operating 20 or 30 locations, that dynamic creates a specific problem. The margin pressure is real, but so is the risk of accelerating traffic loss by raising prices further. Raising prices to combat inflation risks pushing out more price-sensitive consumers. And in a category where traffic is already soft, that’s a trade-off most operators can’t afford to keep making.

    The question, then, is not whether to protect margin. It’s how to do it without asking guests to pay more.

    Value Isn’t What It Used to Mean

    One thing the operating environment last year made clear is that value is not synonymous with price.

    The operators that won in 2025 recognized that value is a calculation of price combined with innovation, not just lower price points. Consumers increasingly focus on value through portion size, experience, or perceived quality, and they’re willing to spend if the overall transaction feels worth it.

    That distinction matters for how multi-unit operators think about growing revenue per transaction. The goal isn’t to charge more for the same thing. It’s to increase the perceived value of the order—and the actual ticket—by introducing items and combinations that guests genuinely want, at a moment when they’re ready to say yes.

    That’s a fundamentally different problem than pricing strategy. And it requires a different tool.

    The Check Average Lever Most Operations Are Leaving on the Table

    For most QSR and fast casual operators, check average growth has historically depended on two levers: menu price increases and labor-driven upsell at the counter. The first lever is under pressure. The second is inconsistent at best.

    Counter-based upselling is subject to human variables—shift fatigue, training quality, rush-hour volume, and turnover. A well-trained team member on a slow Tuesday afternoon is a different upselling engine than an undertrained new hire during a Friday lunch rush. Multiply that variance across 20 or 30 locations, and the revenue opportunity is vast but largely uncaptured.

    The data illustrates the gap clearly. According to QSR Magazine, restaurant customers who interact with self-service kiosks typically purchase 10 to 30% more than those who order from employees. The dynamic is well understood. Guests browse at their own pace, encounter high-margin items presented with visual merchandising, and make additions without the social friction of feeling rushed at a counter. The kiosk doesn’t apply pressure—it creates the conditions for discovery.

    What the Numbers Show for Well-Configured Kiosk Upselling

    The check average lift from kiosks is well-documented. Industry data consistently points to kiosk orders running meaningfully higher in value than counter orders, with variance depending largely on how well the upsell logic is configured.

    A Shake Shack case study is one of the most instructive. Per Restaurant Dive, Shake Shack’s kiosks became its largest and most profitable ordering channel, with kiosk checks running higher by a high-teens percentage than checks in other in-store order channels, according to CFO Katie Fogertey on the company’s Q1 2024 earnings call. 

    As Restaurant Business Online reported, when guests order via kiosk, checks tend to be higher because orders are more likely to include premium LTOs and add-ons; guests also tend to attach a beverage and then eat in-restaurant, which further improves margin by reducing packaging costs.

    Shake Shack’s results were not accidental. Its digital marketing team developed more effective ways to guide guests through the kiosk ordering experience by offering upselling options like adding an extra burger patty or bacon—deliberate configuration choices that translate directly to higher contribution margin per transaction.

    For Bite customers, the results reflect a similar dynamic. The Original ChopShop, a fast casual chain that implemented kiosks using Bite Lift, reported a 15% increase in average check size—an outcome that illustrates what thoughtfully configured AI upselling can do at the point of sale.

    Why AI Upselling Beats Menu Price Increases as a Margin Strategy

    The contribution margin math here is important. A menu price increase lifts revenue per item but risks volume erosion if guests trade down or visit less frequently. An AI-driven upsell that attaches a high contribution margin beverage or side to an existing order captures incremental revenue without changing the price of anything on the menu—and without triggering the value perception problem that price hikes create.

    QSR Magazine notes that kiosk orders typically carry a higher margin than counter orders because the kiosk experience is designed to drive not only check average, but also the sales of higher-margin menu items. That’s the key distinction: the lift isn’t just in ticket size, it’s in the composition of what’s being sold.

    Consider what that means across a portfolio. If an operator running 25 locations improves upsell attachment rate by a modest margin at each kiosk, the compounding effect across daily transaction volume and operating days is substantial. All without a single menu price increase.

    The Consistency Problem at Scale

    For a regional franchisee operating across multiple locations, the check average problem is rarely about any one unit. It’s about variance. A kiosk at location 1 that surfaces the right upsell prompt at the right moment generates a materially different revenue outcome than a kiosk at location 14 with outdated merchandising logic and a poorly sequenced add-on flow.

    Unlike verbal ordering, where upselling depends on employee training and consistency, kiosk-based upselling is standardized by design. That standardization creates controlled experimentation environments where operators can test menu placement, bundling strategies, and item sequencing in ways that were previously impractical in a counter-service setting.

    That’s not just a performance advantage. It’s an operational one. Consistent upsell execution across locations means the revenue opportunity isn’t gated by which crew member is working, which manager prioritized training last month, or how busy the lunch shift happened to be.

    For multi-unit operators, that consistency is the point.

    What Good Kiosk Upselling Looks Like in Practice

    Not all kiosk upselling is created equal. The difference between a well-configured AI upsell flow and a poorly designed one shows up directly in attachment rates and in guest experience.

    Effective AI upsell logic at the kiosk shares a few characteristics. 

    1. Context. The prompt for a breakfast daypart looks different from a dinner upsell, and the suggested add-on reflects what’s actually worth suggesting for the anchor item in the cart. 
    2. Correct Sequencing. A single, well-placed suggestion outperforms three interruptions that feel like pressure. 
    3. Visual merchandising. High-quality imagery and clear pricing reduce friction and increase conversion.

    Bite Lift is built around exactly this kind of precision. Rather than generic “would you like to add a drink?” logic, Bite Lift surfaces item-specific prompts calibrated to what each guest is already ordering—and it does so consistently, at every kiosk, across every location in the portfolio. The result is upsell performance that compounds across transaction volume in a way that counter-based upselling never reliably could.

    The Margin Equation for 2026

    The operators who will protect and grow margins in 2026 are not the ones who raise prices until guests stop coming. They’re the ones who find smarter ways to capture revenue per transaction from guests who are already there—guests who, as the research shows, are frequently open to adding something they weren’t planning to order.

    In a traffic environment where winning new visits is expensive and uncertain, the incremental transaction is one of the highest-ROI opportunities available. AI upselling at the kiosk is the most reliable way to capture it—at scale, consistently, without touching menu prices. If you’re operating in QSR or fast casual and want to understand what that looks like in practice, request a Bite demo and see how Bite Lift performs across your locations.

  • The Hidden Profits in Limited-Time Offers (And How to Capture Them)

    The Hidden Profits in Limited-Time Offers (And How to Capture Them)

    The Limited-Time Offers (LTO) landscape has never been more crowded. According to Technomic data, the number of LTO launches at restaurant chains more than doubled in recent years, rising from 17,790 in 2020 to 36,830 in 2024, and 2025 was tracking even higher at the time the article was written. Across QSR and fast casual, operators are running seasonal promotions at a pace the industry has never seen before.

    The case for running LTOs is well established. TouchBistro’s 2025 American Diner Trends Report found that 62% of diners say they’re motivated to visit a restaurant that has a limited-time offer—and that holds across every generation. LTOs drive traffic. That part is working.

    The problem is how most operators measure whether they worked. If your post-LTO evaluation starts and ends with sales volume, you’re answering the wrong question. Volume tells you if guests ordered it. It doesn’t tell you if the restaurant made money on it.

    That distinction matters more than operators typically acknowledge. The margin opportunity inside a well-run LTO program is real and substantial. But it’s only capturable if it’s designed for from the start—not treated as an afterthought once the item is already on the board.

    The Margin Mistake Most Operators Don’t Catch Until It’s Too Late

    The most common analytical error in LTO pricing isn’t carelessness. It’s using the wrong metric as the primary lens. Most operators price new items by targeting a food cost percentage: hit 28%, hit 30%, and the item passes the test. The problem is that food cost percentage and contribution margin don’t tell the same story.

    Consider a straightforward illustrative example. Item A is priced at $13 with a food cost of $3.90 (30%), producing a contribution margin of $9.10. Item B is priced at $9 with a food cost of $2.25 (25%), producing a contribution margin of $6.75. Item B has a better food cost percentage. Item A generates $2.35 more profit per transaction.

    If you engineer your spring LTO to hit a 28% food cost target and it lands at $9, you may be walking away from more than $2 per order compared to a better-priced item at $13—and that gap compounds fast across a high-volume LTO window.

    This is a documented pattern in menu engineering literature: a dish with a higher margin percentage but low sales can generate less total profit than a lower-percentage dish that sells in volume, and conversely, a higher-priced item with a slightly higher cost percentage can dramatically outperform a cheaper item on pure dollars contributed. Contribution margin, not cost percentage, is the right framework for evaluating LTO profitability.

    The Three Hidden Costs That Eat Your LTO Margin

    Once you have the right metric, the next step is making sure you’re measuring the right costs. Three in particular tend to be undercounted in post-LTO evaluations.

    Operational Complexity

    Every new ingredient, SKU, or prep step added for an LTO carries costs that don’t appear on the recipe card: staff training time, slower throughput, higher error rates, and waste from over-ordering. QSR Magazine’s long-running Drive-Thru Performance Study has consistently documented that menu complexity is one of the primary drivers of slower service times, and that even small increases in order complexity can meaningfully affect throughput. In a format where speed is a core part of the value proposition, that’s a real business cost. The best-designed LTOs lean heavily on ingredients already in the kitchen.

    Waste From Over-Ordering

    Seasonal ingredients purchased in anticipation of LTO volume don’t always move at the forecasted rate. Waste is a direct margin hit that rarely gets factored into the post-LTO review — operators see strong early sales and call the LTO a success, even if the tail end of the window created significant spoilage. Operators who track waste by item during the LTO run get a much cleaner picture of true profitability.

    The Merchandising Gap

    An LTO that guests don’t know about, or don’t understand, doesn’t sell — regardless of how well it was engineered on paper. Research consistently points to a lack of information, rather than price resistance, as a primary barrier to LTO trial. The cost of under-merchandising shows up as opportunity revenue: transactions that could have included the LTO but defaulted to the familiar order instead.

    How to Design an LTO for Profit, Not Just Traffic

    The fix isn’t complicated, but it requires a different sequence. Instead of starting with a menu concept and then checking whether it pencils out, start with the margin floor.

    Start With The Contribution Margin Target

    Before the item is conceived, set a floor. What does this LTO need to contribute per transaction to justify the additional operational overhead? If the floor is a $9.00 contribution margin and your target ingredient cost is $3.50, your minimum price is $12.50. That number anchors the concept development, rather than trailing behind it.

    Build Around What You Already Have

    The most profitable LTOs use existing ingredients in new configurations, or add a single high-impact ingredient to an established base. This constrains the creative brief somewhat, but it dramatically reduces operational complexity costs.

    Price For Perceived Value, Not Cost Convention

    Spring ingredients carry inherently high perceived value. Guests don’t know what asparagus or fresh herbs cost at wholesale, but they know those ingredients feel seasonal and premium. Spring LTOs can often support higher price points than operators assume, particularly when the item is positioned around freshness and limited availability. Don’t let a food cost percentage target set a price ceiling that your guests aren’t actually imposing.

    Set Evaluation Criteria Before Launch

    Define success upfront: a minimum order volume threshold, a CM floor, an acceptable waste percentage, and an upsell attachment target. This transforms the end-of-window decision—keep it, iterate it, retire it—from an emotional call into an analytical one. It also prevents the common trap of keeping a low-margin LTO running too long because it “feels like it’s doing well.”

    The Upsell Layer: Where Kiosk Technology Captures the Profit LTOs Promise

    Del Taco kiosk welcome screens, powered by Bite, showcase LTO offerings at the start of the ordering process.

    Even a well-designed, well-priced LTO only generates its full margin potential if guests actually order it. In a counter service environment, promotional awareness depends on signage, staff mentions, and timing. At the kiosk, it can be systematic.

    AI-driven upsell logic can be configured to surface your spring LTO specifically to guests who haven’t tried it yet, or who have previously ordered similar items. It can prioritize the LTO as a suggested add-on during the window when promotional momentum matters most—typically the first two to three weeks after launch—and deprioritize it as novelty fades. It can also be weighted to push the LTO during slower dayparts, where incremental margin contribution is most valuable.

    The kiosk doesn’t replace the LTO strategy. It executes it consistently, at every transaction, without relying on a team member remembering to mention the special or a guest happening to notice a poster on their way to the counter.

    Bite Lift is built to do exactly this—surfacing the right item to the right guest at the right moment, so the margin opportunity you built into your LTO doesn’t get left on the table at the point of sale.

    The LTO You’re Running Is Probably Worth More Than You Think

    The margin opportunity inside most operators’ LTO programs isn’t theoretical. It’s already there. The question is whether it’s being captured through disciplined pricing and margin-first design, or quietly eroded by the wrong success metric, untracked costs, and inconsistent in-restaurant execution.

    Running more LTOs won’t close that gap. Running them better will. Request a Bite demo to see how AI upselling supports LTO performance at the kiosk—and start capturing the margin your seasonal program is already generating.

  • How to Use Kiosk Sales Data to Build a Better Spring Menu

    How to Use Kiosk Sales Data to Build a Better Spring Menu

    Most operators think of their kiosk as just an ordering tool. But every transaction processed through a kiosk generates structured, queryable data that restaurants can put to good use.

    The spring menu planning process at some QSR and fast casual concepts is still largely intuition-driven: chef instinct, trend reports, and a scan of what competitors just launched. Meanwhile, the kiosk is quietly capturing exactly how guests behave when left to browse and choose on their own, without a server influencing the decision.

    That behavioral data is one of the most underutilized assets in restaurant operations. And spring menu season is the right moment to start using it.

    What Kiosk Data Captures That Counter Service Can’t

    Before making the case for data-driven menu planning, it helps to be specific about what’s actually different about kiosk-generated data.

    Browse Behavior vs. Purchase Behavior

    A kiosk can capture what guests look at before they order: which items they tap into, which they scroll past, and which they linger on before choosing something else. Counter service captures only the final decision. That gap is where you find underperforming items that have an awareness problem versus a genuine preference problem. Those require very different responses.

    Modification Patterns

    Kiosk orders come with clean, structured customization data. When guests consistently modify a specific item the same way, removing an ingredient or swapping a side, that’s a signal either about guest preference or about how the item is currently built. Both matter for menu planning.

    Upsell Acceptance Rates

    Which prompted add-ons do guests accept versus decline? This data tells you what pairs naturally with existing items and, by extension, what’s likely to pair well with new seasonal additions.

    Order Discovery

    Research from 2025 found that 62% of kiosk users reported discovering menu items or customizations they weren’t previously aware of, which also means kiosk data captures how guests navigate and discover, not just what they ultimately order.

    Note: not all kiosk systems expose all of these data points equally. Before building a planning process around any of these signals, operators should confirm what their platform actually surfaces.

    Four Questions to Ask Your Data Before Spring Planning Starts

    This is the practical work. Before finalizing any spring additions or retirements, run through these four questions with your kiosk reporting data.

    1. Which items are selling well but not contributing to profit?

    Map current sales volume against contribution margin, not food cost percentage. High-volume, low-margin items (Plow Horses, in menu engineering terms) are consuming real estate that a better-positioned spring item could occupy. If you’re launching seasonal items without retiring anything, you’re adding menu complexity without improving the economics.

    2. Which high-margin items are underperforming on traffic?

    These are your Puzzles: items with strong economics that guests aren’t choosing. Before spring, understand why. Is it a placement issue on the kiosk screen? A visual merchandising problem with no photo or a weak description? Or a genuine preference mismatch? The answer determines whether a spring refresh addresses it or the item should be retired.

    3. What does your upsell acceptance data say about guest appetite for add-ons?

    If guests are consistently accepting beverage upsells with certain entrees but declining dessert prompts, that’s a signal about how to configure upsell logic for seasonal items. A new spring LTO with a natural beverage pairing should have that pairing built into the upsell flow from day one, not added as an afterthought.

    4. Are there daypart or day-of-week patterns that a seasonal item could address?

    Look for soft spots in your sales mix: lunch lulls, slow Tuesdays, underperforming afternoon windows. A spring LTO positioned specifically for those slots has a more defined job to do and is easier to evaluate post-launch than a general menu addition competing across all dayparts.

    Using Data to Test, Not Just Plan

    The part most operators skip isn’t the planning—it’s the iteration.

    Kiosk data enables a test-and-learn approach to seasonal menus that wasn’t practically possible with counter service alone. The ability to test item placement, adjust upsell prompts, or modify item descriptions in real time, without reprinting physical menus, is one of the most underappreciated operational advantages of kiosk ordering.

    A few specific tactics worth building into your spring launch process:

    Test Item Placement Before Committing To Promotion

    Put a new spring item in two different positions on the kiosk screen for the first two weeks and compare browse and conversion rates before investing in promotional signage.

    Use Upsell Prompts As A Discovery Tool

    Configuring a new seasonal item as a suggested add-on rather than a featured item gives you early signal on guest receptivity before you commit to making it a menu centerpiece.

    Set Evaluation Criteria Before Launch

    Define in advance what success looks like for each spring item: a minimum weekly order volume, a contribution margin floor, or a target upsell attachment rate. This makes the decision to keep, iterate, or retire after four to six weeks objective rather than emotional.

    What to Do With the Data After Spring Ends

    Before retiring spring items, capture the full performance picture: final contribution margin versus projection, upsell attachment rates on each seasonal item, which items appeared most in multi-item orders, and any items that drove measurable traffic lift in targeted dayparts.

    This data becomes the starting point for the rest of seasonal planning. Over time, it builds a compounding picture of how your specific guest base responds to new items—something no trend report or competitor analysis can replicate.

    The operators who use seasonal transitions as data-collection events, not just revenue events, build menus that get more profitable over time. Not just more creative.

    Your Kiosk Already Has the Answers

    The spring menu question most operators ask is: What should we add? The more useful question is: What does our data say we should add?

    Your kiosk is already generating the research. The browse patterns, the modification data, the upsell acceptance rates—all of it is there. The operators who know how to read it will make better seasonal decisions than those who don’t, and they’ll be better positioned for summer planning by the time spring is over.

    For a deeper look at the menu engineering framework that makes sense of this data, see our guide to building a more profitable menu. Or, if you want to see how Bite’s reporting surfaces these insights in practice, request a demo.

  • The Spring Menu Playbook: How Regional Franchise Operators Engineer Seasonal Profitability

    The Spring Menu Playbook: How Regional Franchise Operators Engineer Seasonal Profitability

    At a brand with 10, 20, or 50 locations, the spring menu season looks a little different than it does at the unit level. You’re not designing the menu—corporate is. What you’re doing is something harder: executing someone else’s vision profitably, consistently, across a portfolio of locations with different volume profiles, different staffing realities, and different guest mixes.

    That’s the tension most regional franchise operators don’t talk about openly. The spring LTO comes down from brand. The contribution margin target is yours to hit. The upsell strategy—if there is one—is often under-defined. And the data that would tell you whether any of it is working tends to live in systems that don’t talk to each other cleanly.

    The pressure on either side of that tension is real. 82% of operators reported higher average food costs in 2025, with the NRA’s data showing food costs running more than 35% above pre-pandemic levels. At the same time, 95% of operators say consumers are more value-conscious than they used to be—making price sensitivity a ceiling that’s increasingly difficult to push through, even with a seasonal LTO.

    Spring feels exciting. For a regional operator managing margin across dozens of units, it also carries real risk if it isn’t approached analytically.

    Here’s the argument: seasonal menu transitions are among the highest-leverage moments in a franchise operator’s calendar. Done well, they drive traffic, improve per-guest profitability, and generate location-level data that informs smarter decisions across the rest of the year. Done wrong, they create execution inconsistency across your portfolio—some units running the LTO well, others burying it—and burn operational bandwidth on items that never earn their place.

    Most regional operators treat spring menu planning as an implementation exercise. The ones who outperform treat it as an engineering problem.

    The Menu Engineering Framework, Applied at Scale

    The menu engineering framework isn’t new—it was developed by Michael Kasavana and Donald Smith at Michigan State—but it’s underused at the regional franchise level, where operators often have access to more data than their single-unit counterparts but less freedom to act on it unilaterally.

    Understanding the framework is still essential, because it shapes how you evaluate brand-mandated items against your actual portfolio performance—and how you make the case internally when something isn’t working.

    Graphic of a menu engineering matrix

    The four quadrants:

    Stars: high popularity, high contribution margin. Protect these. They’re the items your locations can’t afford to deprioritize in favor of a new seasonal push.

    Plow Horses: high popularity, low profitability margin. These sell well and feel like wins. They often aren’t. At scale, Plow Horses that dominate the mix quietly suppress your average contribution margin per transaction across every unit.

    Puzzles: low popularity, high profitability margin. These are the items that need your merchandising attention most—and in a kiosk or digital ordering environment, they’re the items most likely to be overlooked without active intervention.

    Dogs: low popularity, low profitability margin. At the regional level, the ability to retire these may sit with brand—but the data case for doing so is yours to build.

    The two metrics that drive the analysis:

    • Profitability/Contribution margin: selling price minus food cost per item. According to NRA data, food and beverage costs for limited-service operators ran a median of 32.4% of sales in 2024—useful context, but food cost percentage can obscure what actually matters at volume. A $14 item with $4 in food cost contributes $10 to margin. A $9 item at 28% food cost contributes $6.48. Across 40 locations doing hundreds of transactions a day, that gap is not theoretical.
    • Popularity index: an item’s share of total sales in its category, tracked per location. At the regional level, this matters not just in aggregate but as a consistency signal—wide variance in popularity index across locations often points to an execution or merchandising problem, not a product problem.

    The spring relevance: every brand-mandated seasonal item should be run through this framework at the regional level before rollout—not to override brand decisions, but to inform how you price, position, and sell them across your portfolio.

    The Spring Opportunity (And the Trap)

    Spring is one of two annual windows—along with fall—when guests actively expect menus to change. That expectation is a genuine asset, and it operates at the brand level as much as the unit level. Guests who follow the brand are primed for something new. The regional operator’s job is to convert that priming into actual margin.

    What the spring window makes possible at the regional level:

    • Phasing out underperforming items without guest friction—seasonal transitions give cover for removal that mid-year changes don’t
    • Introducing brand-designed LTOs with a local execution strategy that the brand hasn’t fully specified (more on that in Section 4)
    • Using the novelty of seasonal items to test upsell prompts and price attachment behavior across your portfolio—data that becomes proprietary insight for your group

    Spring ingredients—asparagus, strawberries, lemon, peas, fresh herbs, lighter proteins—carry strong perceived value with guests. When sourced in season, they tend to support favorable margins relative to their perceived quality. That’s the brand’s sourcing call, but the margin benefit is yours to protect or lose in execution.

    The trap at the regional level looks different from what it does for independent operators.

    It’s not usually a failure to design the right items. It’s a failure to execute them consistently across locations. Three patterns show up repeatedly in regional franchise portfolios:

    Inconsistent rollout across units. Some locations merchandise the spring LTO aggressively; others treat it like a footnote. The result is wide performance variance that makes it nearly impossible to evaluate whether the item itself works. You can’t improve what you can’t measure cleanly.

    Treating the brand’s LTO strategy as the complete strategy. Brand provides the item, the pricing, and the promotional materials. What brand often doesn’t provide is a location-level upsell plan, a merchandising sequence for kiosk and digital ordering, or a defined evaluation framework. Filling those gaps is the regional operator’s leverage point.

    Pricing drift at the unit level. In multi-unit portfolios, it’s common for individual locations to apply discounts, modify modifiers, or run local promotions that quietly erode the contribution margin of a brand-designed LTO. At 10 units, this is manageable. At 50 units, it becomes a significant margin leak if it isn’t actively monitored.

    Start with Your Portfolio Data, Not the Brand Playbook

    The instinct at the regional level is often to wait for brand guidance before doing any planning. That’s an understandable instinct—and it leaves significant value on the table.

    The data audit that should happen before any spring rollout begins is entirely within your control, and it shapes how you execute regardless of what brand provides.

    The right questions to ask across your portfolio before spring planning begins:

    • Which locations have the highest average contribution margin per transaction, and what’s driving the difference? Understanding your top performers’ item mix tells you something about what to replicate in merchandising and upsell strategy.
    • Where do your current Stars and Plow Horses sit across locations? An item that performs as a Star at your top-volume units may be a Plowhorse at lower-volume locations. And that distinction changes how you merchandise it.
    • Which items consistently appear in multi-item orders? Attachment behavior varies by location and daypart, and that variation is information. A spring LTO that pairs naturally with a high-attachment item is a better upsell target than one that stands alone.
    • Are there daypart gaps that a spring item could address? A lighter spring offering that drives lunch traffic is more valuable to your portfolio than one that spikes on weekend dinner and fades by mid-week.

    The kiosk advantage for regional operators:

    At 10–50 units, kiosk and digital ordering data are among the most valuable assets you have—and it’s often underused. Unlike verbal ordering data, kiosk data is structured, consistent, and captures behavior that aggregated POS data misses: what was browsed versus purchased, which add-ons were accepted at which locations, and how item placement on the screen affected sales mix across your portfolio.

    This is the data foundation for informed spring planning. It’s also the input layer that Bite Lift uses to surface the right upsell at the right moment—not as a static prompt, but as a dynamic recommendation tuned to the guest, the item, and your margin priorities.

    Building Your Execution Strategy Around Brand LTOs

    The LTO environment across the industry right now is more competitive than it’s ever been. According to Technomic Ignite Menu data, LTO launches rose 19% year over year as of late 2025, with the full year tracking 10% above 2024. Technomic tracked 17,790 restaurant LTO launches in 2020; by 2024, that figure had grown to 36,830—more than double in five years. And 55% of consumers now say a restaurant’s LTO offerings factor into where they choose to eat, up from 50% in 2022.

    For a regional franchisee, those numbers mean two things simultaneously: brand’s instinct to run seasonal LTOs is strategically correct, and the execution gap between operators who merchandise them well and operators who don’t is growing more consequential.

    Where regional operators build their edge:

    Operational preparation before launch, not after. Brand announces the spring LTO. The question to answer before it hits your locations: Does this item extend prep workflow in ways that create throughput risk at peak hours? If so, which locations are most exposed, and what’s the mitigation plan? The operators who ask these questions before launch are the ones who don’t spend six weeks watching a good item underperform because of a fixable execution problem.

    A location-level merchandising plan. Research from Kerry found that 88% of consumers rated point-of-sale promotions as one of the three most influential purchase drivers for LTOs—making in-the-moment presentation a primary driver of LTO performance, not a secondary one. Brand may provide creative assets—the question is whether those assets are being deployed at every location, in every relevant touchpoint, with the same consistency. In a 50-unit portfolio, the answer is seldom yes without active oversight.

    Pre-defined evaluation criteria. Before a spring LTO launches across your portfolio, define the benchmarks: What sales volume justifies the operational complexity? At what contribution margin does the item earn a permanent recommendation to brand? What upsell attachment rate indicates the item has real cross-sell potential? Setting these benchmarks before launch transforms the LTO from a brand mandate you’re executing into a business experiment you’re running—with findings that have value beyond the season.

    Monitoring for margin drift. Across 10–50 locations, discount application, modifier behavior, and local promotional decisions can quietly erode the profitability/contribution margin of a brand-designed item. Building a monitoring cadence into your spring rollout—not just for sales volume but for actual contribution margin by location—is the difference between knowing your LTO is working and assuming it is.

    How AI Upselling Changes the Seasonal Execution Equation

    The structural challenge for regional operators running a spring menu isn’t getting guests to the restaurant. It’s getting guests who are already there—already at the kiosk, already in the app—to engage with a new item they didn’t come in planning to order.

    Human upselling is inconsistent at scale. A motivated team member at your best location might mention the spring special on 70% of interactions. Across 50 locations with varying staff tenure, training compliance, and peak-hour pressure, that number drops significantly and unpredictably. Traditional kiosk upsell prompts are an improvement—they’re consistent, but they’re static. They present the same prompt to every guest at the same moment, regardless of order history, item affinity, or which items in your portfolio need merchandising support most.

    AI-driven upsell via kiosks changes the equation for regional operators in three concrete ways:

    Targeting by guest behavior, not just by prompt position. A guest whose order history shows affinity for lighter proteins is a different upsell target for a spring salad than a guest whose history is built around burgers and loaded fries. Bite Lift surfaces seasonal items to guests who are most likely to convert, rather than presenting the same prompt to every guest and measuring the average.

    Weighted toward your margin priorities. The items that need active merchandising support are almost always Puzzles—high contribution margin, lower organic popularity. A well-configured AI upsell system via kiosk can be weighted to push those items harder across your portfolio, turning underperforming high-margin SKUs into active contributors. This is the kind of portfolio-level margin management that’s difficult to achieve through staff training alone.

    Consistent across every location, every shift. For a regional operator, consistency of execution is the variable that determines whether portfolio-level analysis means anything. If your top five locations are executing the spring upsell strategy well and your bottom ten aren’t, your aggregate data is noise. Bite Lift delivers the same quality of upsell execution at every kiosk, across every unit, on every shift—which means the data you get back is actually actionable.

    The Post-Season Data Harvest

    This is the step most regional operators skip—and where the compounding value of disciplined execution either gets captured or evaporates.

    The spring menu is not just a revenue event for your portfolio. It’s a research event. Every LTO and seasonal item generates location-level data about guest preference, price sensitivity, attachment behavior, and operational throughput that has direct implications for fall planning—and for the case you make to brand about what worked, what didn’t, and what should change.

    Before retiring spring items, capture across your portfolio:

    • Final contribution margin versus projected, by location. Did margin drift occur? Where, and why? This is the data that identifies which locations need operational or training attention before the next seasonal rollout.
    • Upsell attachment rate by location and daypart. Wide variance here is an execution signal. Locations with strong attachment rates are doing something replicable. Locations with weak attachment rates need a different intervention.
    • Multi-item order frequency for seasonal items. Which spring items appeared most often alongside other items? Strong pair performance is a signal for future bundling strategy and kiosk menu architecture.
    • Any items that generated repeat guest requests after retirement. This is among the strongest signals you can bring to brand when making the case for a permanent addition or a returning LTO next spring.

    Regional operators who build this feedback loop systematically such as using spring data to inform fall design, fall data to inform the following spring, create a compounding advantage over operators who treat each season as a fresh start. Over a two- to three-year horizon, the margin gap between those two operating approaches becomes significant.

    Menu Engineering Is a System, Not a Season

    For a regional franchise operator running 10 to 50 locations, the spring menu season is never just about the items. It’s about execution consistency, contribution margin management across a portfolio, and turning brand-level decisions into location-level performance.

    The operators who outperform in Q2 are the ones who start with a data audit instead of a brand briefing, define their evaluation criteria before launch instead of after, and close the execution gap at the kiosk with tools that don’t depend on staff consistency to deliver results.

    The tools to do this at the regional scale already exist. The question is whether you’re using them.